Ceph cluster, SATA HDDs out, SATA SSDs in
Table of Contents
When I built my Ceph cluster in March 2020, I used old SATA HDDs I still had on the shelf. It was always clear that at some point these old consumables would die and need replacing. That time has come and I went with 3x 2TB SATA SSD OSD per node.

Summary
Previously each of the four nodes had a small SATA SSD (500 GB for WAL and DB) plus 3 HDDs. After the change, each of the four nodes has three 2TB SATA SSDs, one OSD per SSD, no separate WAL/DB device.
While performance is better and I run on 12 new storage devices (as opposed to 12 old ones), this is of course still not comparable to enterprise class hardware. But for the homelab it will do for now.
Ordered devices
| quantity | name |
|---|---|
| 2 | Patriot SSD P210 2.5 SATA 2TB |
| 2 | Intenso SSD 3812470 SATA3 2TB |
| 2 | Silicon Power SSD Ace A55 2TB |
| 2 | PNY CS900 2.5 SATA3 2TB |
| 2 | Crucial BX500 SSD 2.5 2TB |
| 2 | Samsung SSD 870 QVO 2TB SATA 2.5 |
Yes, I am fully aware that price wise this is the very bottom of the barrel. Which is why I chose 6 different vendors, SATA SSDs are a consumable to me, they will break eventually, this mix should help spread the risk of multiple SSDs dying in close succession.
OSDs with HDD out, only SSD in
My old OSDs were 3xHDD (1 or 2 TB) plus 1xSSD (500 GB) shred per 3 OSDs on each node. These were all removed and replaced with 3x 2TB SATA SSD OSDs. The one small (500 GB) SATA SSD per node, previously used for WAL/DB for 3 HDD OSDs, was recycled in my Proxmox VE playground.
First node
Node number 4 was evacuated of OSDs earlier (after 2 of the 3 HDDs in it died), so I plugged 3 SSDs in and now have the following;
| bay | model | note |
|---|---|---|
| 1 | Crucial CT120BX500SSD1 | 120 GB SSD with operating system |
| 2 | Patriot SSD P210 2.5 SATA 2TB | osd.0 |
| 3 | Silicon Power SSD Ace A55 2TB | osd.1 |
| 4 | Crucial BX500 SSD 2.5 2TB | osd.5 |
| 5 | empty |
Since my nodes only have 12 GiB RAM, I decided on 3 OSDs per node and 3 GiB RAM memory target per OSD. Far from ideal but the nodes cannot use more memory (if the 4 GiB it comes with were not soldered, then I could have 16 GiB).
Used drive spec
I wrote myself the following drive spec, wanting all free SSDs on my F5-422 nodes to be used and crypted.
service_type: osd
service_id: osd_spec_F5-422_SSDs
placement:
  host_pattern: 'f5-422-*'
encrypted: true
data_devices:
  rotational: 0
Test the drive spec
Simply as per the RHCS5 docs
[root@f5-422-01 ~]# cephadm shell --mount f5-422-SSD-as-OSD-spec.yml:/var/lib/ceph/osd/f5-422-SSD-as-OSD-spec.yml
[root@f5-422-01 ~]# vim f5-422-SSD-as-OSD-spec.yml
[root@f5-422-01 ~]# cephadm shell --mount f5-422-SSD-as-OSD-spec.yml:/var/lib/ceph/osd/f5-422-SSD-as-OSD-spec.yml
Inferring fsid 720b4911-bb6e-4774-88ae-dc2d3d3b9bfb
Using recent ceph image registry.redhat.io/rhceph/rhceph-5-rhel8@sha256:a42c490ba7aa8732ebc53a90ce33c4cb9cf8e556395cc9598f8808e0b719ebe7
[ceph: root@f5-422-01 /]# cd /var/lib/ceph/osd/
[ceph: root@f5-422-01 osd]# cat f5-422-SSD-as-OSD-spec.yml
service_type: osd
service_id: osd_spec_F5-422_SSDs
placement:
  host_pattern: 'f5-422-*'
encrypted: true
data_devices:
  rotational: 0
[ceph: root@f5-422-01 osd]# ceph orch apply -i f5-422-SSD-as-OSD-spec.yml --dry-run
WARNING! Dry-Runs are snapshots of a certain point in time and are bound
to the current inventory setup. If any of these conditions change, the
preview will be invalid. Please make sure to have a minimal
timeframe between planning and applying the specs.
####################
SERVICESPEC PREVIEWS
####################
+---------+------+--------+-------------+
|SERVICE  |NAME  |ADD_TO  |REMOVE_FROM  |
+---------+------+--------+-------------+
+---------+------+--------+-------------+
################
OSDSPEC PREVIEWS
################
Preview data is being generated.. Please re-run this command in a bit.
I waited a bit, as instructed, before checking again;
[ceph: root@f5-422-01 osd]# ceph orch apply -i f5-422-SSD-as-OSD-spec.yml --dry-run
WARNING! Dry-Runs are snapshots of a certain point in time and are bound
to the current inventory setup. If any of these conditions change, the
preview will be invalid. Please make sure to have a minimal
timeframe between planning and applying the specs.
####################
SERVICESPEC PREVIEWS
####################
+---------+------+--------+-------------+
|SERVICE  |NAME  |ADD_TO  |REMOVE_FROM  |
+---------+------+--------+-------------+
+---------+------+--------+-------------+
################
OSDSPEC PREVIEWS
################
+---------+----------------------+-----------------------------+----------+----+-----+
|SERVICE  |NAME                  |HOST                         |DATA      |DB  |WAL  |
+---------+----------------------+-----------------------------+----------+----+-----+
|osd      |osd_spec_F5-422_SSDs  |f5-422-04.internal.pcfe.net  |/dev/sdb  |-   |-    |
|osd      |osd_spec_F5-422_SSDs  |f5-422-04.internal.pcfe.net  |/dev/sdd  |-   |-    |
|osd      |osd_spec_F5-422_SSDs  |f5-422-04.internal.pcfe.net  |/dev/sde  |-   |-    |
+---------+----------------------+-----------------------------+----------+----+-----+
Use the drive spec
As it picked up the drives I was expecting, I applied the specification;
[ceph: root@f5-422-01 osd]# ceph orch apply -i f5-422-SSD-as-OSD-spec.yml
Scheduled osd.osd_spec_F5-422_SSDs update...
A short while later, as expected, cephadm deployed the 3 OSDs.
Remaining nodes
It’s really just a case of repeating the same procedure;
- remove OSDs of a node via
ceph orch - wait for completion
- physically replace drives
- wait for automatic creation of OSDs on new empty drives, as per drive spec
- wait for all Placement Groups to be
active+clean
As I put in a drive spec that applies to all four nodes, the only thing to watch out was to not wipe the small SSD before physically removing it or to tell Ceph to temporarily not apply. This is expected, see upstream docs for details.
Since rinse, wash, repeat procedures are boring, that text is collapsed. But you can expand if you do care about the details.
Details of the remaining nodes drive swaps (click to expand).
Evacuating node 3
Turns out that the SSDs arrived just in time, this morning one more HDD just died. OSD 4 on node 3. So I removed it;
[ceph: root@f5-422-01 osd]# ceph orch osd rm 4
Scheduled OSD(s) for removal
[ceph: root@f5-422-01 osd]# date ; ceph orch osd rm status
Fri Mar 17 15:53:27 UTC 2023
OSD  HOST                         STATE                    PGS  REPLACE  FORCE  ZAP    DRAIN STARTED AT
4    f5-422-03.internal.pcfe.net  done, waiting for purge    0  False    False  False
Might as well evacuate the remaining 2 OSDs on that node
[ceph: root@f5-422-01 osd]# date ; ceph orch osd rm 8 15 --zap
Fri Mar 17 15:54:48 UTC 2023
Scheduled OSD(s) for removal
[ceph: root@f5-422-01 osd]# date ; ceph orch osd rm status
Fri Mar 17 15:54:53 UTC 2023
OSD  HOST                         STATE                    PGS  REPLACE  FORCE  ZAP    DRAIN STARTED AT
4    f5-422-03.internal.pcfe.net  done, waiting for purge    0  False    False  False
8    f5-422-03.internal.pcfe.net  draining                  91  False    False  True   2023-03-17 15:54:50.285459
15   f5-422-03.internal.pcfe.net  draining                 186  False    False  True   2023-03-17 15:54:51.171398
Waiting for clean PGs
Now all that is left to do is wait for clean placement groups (PG) and then rinse, wash, repeat
Just under an hour in
[ceph: root@f5-422-01 osd]# date ; ceph orch osd rm status
Fri Mar 17 16:44:15 UTC 2023
OSD  HOST                         STATE                    PGS  REPLACE  FORCE  ZAP    DRAIN STARTED AT
4    f5-422-03.internal.pcfe.net  done, waiting for purge    0  False    False  False
8    f5-422-03.internal.pcfe.net  draining                  65  False    False  True   2023-03-17 15:54:50.285459
15   f5-422-03.internal.pcfe.net  draining                 140  False    False  True   2023-03-17 15:54:51.171398
[ceph: root@f5-422-01 osd]# ceph osd tree
ID   CLASS  WEIGHT    TYPE NAME            STATUS  REWEIGHT  PRI-AFF
 -1         13.73222  root default
 -9          4.09348      host f5-422-01
  2    hdd   1.97089          osd.2            up   1.00000  1.00000
  6    hdd   1.06129          osd.6            up   1.00000  1.00000
 10    hdd   1.06129          osd.10           up   1.00000  1.00000
 -7          3.03218      host f5-422-02
  3    hdd   1.97089          osd.3            up   1.00000  1.00000
 11    hdd   1.06129          osd.11           up   1.00000  1.00000
 -5          1.06129      host f5-422-03
  4    hdd   1.06129          osd.4          down         0  1.00000
  8    hdd         0          osd.8            up   1.00000  1.00000
 15    hdd         0          osd.15           up   1.00000  1.00000
 -3          5.54527      host f5-422-04
  0    ssd   1.86299          osd.0            up   1.00000  1.00000
  1    ssd   1.86299          osd.1            up   1.00000  1.00000
  5    ssd   1.81929          osd.5            up   1.00000  1.00000
-11                0      host ts-473a-01
[ceph: root@f5-422-01 osd]# ceph -s
  cluster:
    id:     720b4911-bb6e-4774-88ae-dc2d3d3b9bfb
    health: HEALTH_WARN
            1 failed cephadm daemon(s)

  services:
    mon: 3 daemons, quorum f5-422-01,f5-422-02,f5-422-03 (age 2h)
    mgr: f5-422-02(active, since 7d), standbys: f5-422-01, f5-422-03
    mds: 1/1 daemons up, 1 standby
    osd: 11 osds: 10 up (since 65m), 10 in (since 67m); 204 remapped pgs
    rgw: 1 daemon active (1 hosts, 1 zones)

  data:
    volumes: 1/1 healthy
    pools:   16 pools, 329 pgs
    objects: 1.43M objects, 736 GiB
    usage:   3.4 TiB used, 12 TiB / 16 TiB avail
    pgs:     1591310/4303725 objects misplaced (36.975%)
             192 active+remapped+backfill_wait
             125 active+clean
             12  active+remapped+backfilling

  io:
    client:   103 KiB/s rd, 2.7 MiB/s wr, 0 op/s rd, 103 op/s wr
    recovery: 48 MiB/s, 35 objects/s
About 2.5 hours in
[ceph: root@f5-422-01 osd]# date ; ceph orch osd rm status
Fri Mar 17 18:14:35 UTC 2023
OSD  HOST                         STATE                    PGS  REPLACE  FORCE  ZAP    DRAIN STARTED AT
4    f5-422-03.internal.pcfe.net  done, waiting for purge    0  False    False  False
8    f5-422-03.internal.pcfe.net  draining                  40  False    False  True   2023-03-17 15:54:50.285459
15   f5-422-03.internal.pcfe.net  draining                  76  False    False  True   2023-03-17 15:54:51.171398
[ceph: root@f5-422-01 osd]# date ; ceph -s
Fri Mar 17 18:14:44 UTC 2023
  cluster:
    id:     720b4911-bb6e-4774-88ae-dc2d3d3b9bfb
    health: HEALTH_WARN
            1 failed cephadm daemon(s)

  services:
    mon: 3 daemons, quorum f5-422-01,f5-422-02,f5-422-03 (age 4h)
    mgr: f5-422-02(active, since 7d), standbys: f5-422-01, f5-422-03
    mds: 1/1 daemons up, 1 standby
    osd: 11 osds: 10 up (since 2h), 10 in (since 2h); 116 remapped pgs
    rgw: 1 daemon active (1 hosts, 1 zones)

  data:
    volumes: 1/1 healthy
    pools:   16 pools, 329 pgs
    objects: 1.43M objects, 736 GiB
    usage:   3.4 TiB used, 12 TiB / 16 TiB avail
    pgs:     1050758/4303731 objects misplaced (24.415%)
             213 active+clean
             107 active+remapped+backfill_wait
             9   active+remapped+backfilling

  io:
    client:   914 KiB/s wr, 0 op/s rd, 20 op/s wr
    recovery: 31 MiB/s, 86 objects/s
Nearly done
[ceph: root@f5-422-01 osd]# date ; ceph orch osd rm status
Fri Mar 17 20:58:51 UTC 2023
OSD  HOST                         STATE                    PGS  REPLACE  FORCE  ZAP    DRAIN STARTED AT
4    f5-422-03.internal.pcfe.net  done, waiting for purge    0  False    False  False
8    f5-422-03.internal.pcfe.net  draining                   5  False    False  True   2023-03-17 15:54:50.285459
15   f5-422-03.internal.pcfe.net  draining                  11  False    False  True   2023-03-17 15:54:51.171398
[ceph: root@f5-422-01 osd]# date ; ceph -s
Fri Mar 17 20:58:55 UTC 2023
  cluster:
    id:     720b4911-bb6e-4774-88ae-dc2d3d3b9bfb
    health: HEALTH_WARN
            1 failed cephadm daemon(s)

  services:
    mon: 3 daemons, quorum f5-422-01,f5-422-02,f5-422-03 (age 6h)
    mgr: f5-422-02(active, since 7d), standbys: f5-422-01, f5-422-03
    mds: 1/1 daemons up, 1 standby
    osd: 11 osds: 10 up (since 5h), 10 in (since 5h); 16 remapped pgs
    rgw: 1 daemon active (1 hosts, 1 zones)

  data:
    volumes: 1/1 healthy
    pools:   16 pools, 329 pgs
    objects: 1.43M objects, 736 GiB
    usage:   3.4 TiB used, 12 TiB / 16 TiB avail
    pgs:     348391/4303734 objects misplaced (8.095%)
             313 active+clean
             8   active+remapped+backfilling
             8   active+remapped+backfill_wait

  io:
    client:   85 KiB/s rd, 2.1 MiB/s wr, 8 op/s rd, 37 op/s wr
    recovery: 17 MiB/s, 59 objects/s
3/17/23 11:10:20 PM[INF]Cluster is now healthy

3/17/23 11:10:20 PM[INF]Health check cleared: CEPHADM_FAILED_DAEMON (was: 1 failed cephadm daemon(s))

3/17/23 11:10:15 PM[INF]Detected new or changed devices on f5-422-03.internal.pcfe.net

3/17/23 11:10:01 PM[INF]Zapping devices for osd.15 on f5-422-03.internal.pcfe.net

3/17/23 11:10:01 PM[INF]Successfully purged osd.15 on f5-422-03.internal.pcfe.net

3/17/23 11:10:01 PM[INF]Health check cleared: OSD_HOST_DOWN (was: 1 host (1 osds) down)

3/17/23 11:10:01 PM[INF]Health check cleared: OSD_DOWN (was: 1 osds down)

3/17/23 11:10:01 PM[INF]Successfully removed osd.15 on f5-422-03.internal.pcfe.net

3/17/23 11:10:01 PM[INF]Removing key for osd.15

3/17/23 11:10:00 PM[INF]Health check cleared: PG_AVAILABILITY (was: Reduced data availability: 1 pg peering)

3/17/23 11:09:55 PM[WRN]Health check failed: Reduced data availability: 3 pgs peering (PG_AVAILABILITY)

3/17/23 11:09:53 PM[INF]Removing daemon osd.15 from f5-422-03.internal.pcfe.net

3/17/23 11:09:53 PM[INF]osd.15 now down

3/17/23 11:09:53 PM[WRN]Health check failed: 1 host (1 osds) down (OSD_HOST_DOWN)

3/17/23 11:09:53 PM[WRN]Health check failed: 1 osds down (OSD_DOWN)

3/17/23 11:09:52 PM[INF]Successfully purged osd.4 on f5-422-03.internal.pcfe.net

3/17/23 11:09:52 PM[INF]Successfully removed osd.4 on f5-422-03.internal.pcfe.net

3/17/23 11:09:52 PM[INF]Removing key for osd.4

3/17/23 11:09:50 PM[INF]Removing daemon osd.4 from f5-422-03.internal.pcfe.net

3/17/23 11:09:50 PM[INF]osd.4 now down

3/17/23 11:00:59 PM[INF]Detected new or changed devices on f5-422-03.internal.pcfe.net

3/17/23 11:00:49 PM[INF]Successfully zapped devices for osd.8 on f5-422-03.internal.pcfe.net

3/17/23 11:00:44 PM[INF]Zapping devices for osd.8 on f5-422-03.internal.pcfe.net

3/17/23 11:00:44 PM[INF]Successfully purged osd.8 on f5-422-03.internal.pcfe.net

3/17/23 11:00:44 PM[INF]Health check cleared: OSD_DOWN (was: 1 osds down)

3/17/23 11:00:44 PM[INF]Successfully removed osd.8 on f5-422-03.internal.pcfe.net

3/17/23 11:00:44 PM[INF]Removing key for osd.8

3/17/23 11:00:38 PM[WRN]Monitor daemon marked osd.8 down, but it is still running

3/17/23 11:00:38 PM[INF]osd.8 marked itself dead as of e42811

3/17/23 11:00:37 PM[INF]Removing daemon osd.8 from f5-422-03.internal.pcfe.net

3/17/23 11:00:37 PM[INF]osd.8 now down
And, as expected because of the above drive spec, once the next Detected new or changed devices on f5-422-03.internal.pcfe.net happened, 3 new OSDs were rolled out automatically.
Evacuate node 2
[ceph: root@f5-422-01 /]# ceph osd tree
ID   CLASS  WEIGHT    TYPE NAME            STATUS  REWEIGHT  PRI-AFF
 -1         18.17250  root default
 -9          4.09348      host f5-422-01
  2    hdd   1.97089          osd.2            up   1.00000  1.00000
  6    hdd   1.06129          osd.6            up   1.00000  1.00000
 10    hdd   1.06129          osd.10           up   1.00000  1.00000
 -7          3.03218      host f5-422-02
  3    hdd   1.97089          osd.3            up   1.00000  1.00000
 11    hdd   1.06129          osd.11           up   1.00000  1.00000
 -5          5.50157      host f5-422-03
  4    ssd   1.86299          osd.4            up   1.00000  1.00000
  7    ssd   1.81929          osd.7            up   1.00000  1.00000
  8    ssd   1.81929          osd.8            up   1.00000  1.00000
 -3          5.54527      host f5-422-04
  0    ssd   1.86299          osd.0            up   1.00000  1.00000
  1    ssd   1.86299          osd.1            up   1.00000  1.00000
  5    ssd   1.81929          osd.5            up   1.00000  1.00000
-11                0      host ts-473a-01
[ceph: root@f5-422-01 /]# ceph orch osd rm 3 11
Scheduled OSD(s) for removal
[ceph: root@f5-422-01 /]# date ; ceph orch osd rm status
Fri Mar 17 22:53:03 UTC 2023
OSD  HOST                         STATE     PGS  REPLACE  FORCE  ZAP    DRAIN STARTED AT
3    f5-422-02.internal.pcfe.net  draining  181  False    False  False  2023-03-17 22:53:03.110470
11   f5-422-02.internal.pcfe.net  draining   94  False    False  False  2023-03-17 22:53:04.100753
went to bed, was finished next day.
[ceph: root@f5-422-01 /]# date ; ceph orch osd rm status
Sat Mar 18 11:19:06 UTC 2023
No OSD remove/replace operations reported
[ceph: root@f5-422-01 /]# ceph osd tree
ID   CLASS  WEIGHT    TYPE NAME            STATUS  REWEIGHT  PRI-AFF
 -1         15.14032  root default
 -9          4.09348      host f5-422-01
  2    hdd   1.97089          osd.2            up   1.00000  1.00000
  6    hdd   1.06129          osd.6            up   1.00000  1.00000
 10    hdd   1.06129          osd.10           up   1.00000  1.00000
 -7                0      host f5-422-02
 -5          5.50157      host f5-422-03
  4    ssd   1.86299          osd.4            up   1.00000  1.00000
  7    ssd   1.81929          osd.7            up   1.00000  1.00000
  8    ssd   1.81929          osd.8            up   1.00000  1.00000
 -3          5.54527      host f5-422-04
  0    ssd   1.86299          osd.0            up   1.00000  1.00000
  1    ssd   1.86299          osd.1            up   1.00000  1.00000
  5    ssd   1.81929          osd.5            up   1.00000  1.00000
-11                0      host ts-473a-01
[ceph: root@f5-422-01 /]# ceph -s
  cluster:
    id:     720b4911-bb6e-4774-88ae-dc2d3d3b9bfb
    health: HEALTH_OK

  services:
    mon: 3 daemons, quorum f5-422-01,f5-422-02,f5-422-03 (age 2m)
    mgr: f5-422-02(active, since 8d), standbys: f5-422-01, f5-422-03
    mds: 1/1 daemons up, 1 standby
    osd: 9 osds: 9 up (since 89s), 9 in (since 12h)
    rgw: 1 daemon active (1 hosts, 1 zones)

  data:
    volumes: 1/1 healthy
    pools:   16 pools, 329 pgs
    objects: 1.43M objects, 737 GiB
    usage:   2.7 TiB used, 12 TiB / 15 TiB avail
    pgs:     329 active+clean

  io:
    client:   400 KiB/s wr, 0 op/s rd, 12 op/s wr
zapped the 500GB SATA SSD that will be put in the Proxmox VE playground;
[ceph: root@f5-422-01 /]# ceph orch device ls f5-422-02.internal.pcfe.net
HOST                         PATH      TYPE  DEVICE ID                          SIZE  AVAILABLE  REFRESHED  REJECT REASONS
f5-422-02.internal.pcfe.net  /dev/sdc  ssd   Samsung_SSD_860_[DACTED]             500G             9m ago     Insufficient space (<10 extents) on vgs, LVM detected, locked
f5-422-02.internal.pcfe.net  /dev/sdd  hdd   ST2000VM003-1CT1_[REDACTED]         2000G             9m ago     Insufficient space (<10 extents) on vgs, LVM detected, locked
f5-422-02.internal.pcfe.net  /dev/sdf  hdd   WDC_WD10EFRX-68P_WD-[REDACTED]      1000G             9m ago     Insufficient space (<10 extents) on vgs, LVM detected, locked
[ceph: root@f5-422-01 /]# ceph orch device zap f5-422-02.internal.pcfe.net /dev/sdc
Error EINVAL: must pass --force to PERMANENTLY ERASE DEVICE DATA
[ceph: root@f5-422-01 /]# ceph orch device zap f5-422-02.internal.pcfe.net --force /dev/sdc
zap successful for /dev/sdc on f5-422-02.internal.pcfe.net
and then pulled that device but, as kind of expected, that was dumb as the drive spec was still active, doh!
So I powered down node 2 swapped all storage and powered it back again. Ceph healed itself :-)
[ceph: root@f5-422-01 /]# date ; ceph osd tree
Sat Mar 18 11:56:12 UTC 2023
ID   CLASS  WEIGHT    TYPE NAME            STATUS  REWEIGHT  PRI-AFF
 -1         20.68559  root default
 -9          4.09348      host f5-422-01
  2    hdd   1.97089          osd.2            up   1.00000  1.00000
  6    hdd   1.06129          osd.6            up   1.00000  1.00000
 10    hdd   1.06129          osd.10           up   1.00000  1.00000
 -7          5.54527      host f5-422-02
  3    ssd   1.86299          osd.3            up   1.00000  1.00000
  9    ssd   1.86299          osd.9            up   1.00000  1.00000
 11    ssd   1.81929          osd.11           up   1.00000  1.00000
 -5          5.50157      host f5-422-03
  4    ssd   1.86299          osd.4            up   1.00000  1.00000
  7    ssd   1.81929          osd.7            up   1.00000  1.00000
  8    ssd   1.81929          osd.8            up   1.00000  1.00000
 -3          5.54527      host f5-422-04
  0    ssd   1.86299          osd.0            up   1.00000  1.00000
  1    ssd   1.86299          osd.1            up   1.00000  1.00000
  5    ssd   1.81929          osd.5            up   1.00000  1.00000
-11                0      host ts-473a-01
Last node
[ceph: root@f5-422-01 /]# date ; ceph osd tree
Sat Mar 18 11:56:12 UTC 2023
ID   CLASS  WEIGHT    TYPE NAME            STATUS  REWEIGHT  PRI-AFF
 -1         20.68559  root default
 -9          4.09348      host f5-422-01
  2    hdd   1.97089          osd.2            up   1.00000  1.00000
  6    hdd   1.06129          osd.6            up   1.00000  1.00000
 10    hdd   1.06129          osd.10           up   1.00000  1.00000
 -7          5.54527      host f5-422-02
  3    ssd   1.86299          osd.3            up   1.00000  1.00000
  9    ssd   1.86299          osd.9            up   1.00000  1.00000
 11    ssd   1.81929          osd.11           up   1.00000  1.00000
 -5          5.50157      host f5-422-03
  4    ssd   1.86299          osd.4            up   1.00000  1.00000
  7    ssd   1.81929          osd.7            up   1.00000  1.00000
  8    ssd   1.81929          osd.8            up   1.00000  1.00000
 -3          5.54527      host f5-422-04
  0    ssd   1.86299          osd.0            up   1.00000  1.00000
  1    ssd   1.86299          osd.1            up   1.00000  1.00000
  5    ssd   1.81929          osd.5            up   1.00000  1.00000
-11                0      host ts-473a-01
[ceph: root@f5-422-01 /]# ceph orch osd rm 2 6 10
Scheduled OSD(s) for removal
[ceph: root@f5-422-01 /]# date ; ceph orch osd rm status
Sat Mar 18 11:57:44 UTC 2023
OSD  HOST                         STATE     PGS  REPLACE  FORCE  ZAP    DRAIN STARTED AT
2    f5-422-01.internal.pcfe.net  draining  142  False    False  False  2023-03-18 11:57:41.521775
6    f5-422-01.internal.pcfe.net  draining   72  False    False  False  2023-03-18 11:57:42.516314
10   f5-422-01.internal.pcfe.net  draining   60  False    False  False  2023-03-18 11:57:40.984641
finished fine
[ceph: root@f5-422-01 /]# date ; ceph orch osd rm status
Sat Mar 18 13:54:29 UTC 2023
No OSD remove/replace operations reported
[ceph: root@f5-422-01 /]# date ; ceph osd tree
Sat Mar 18 13:54:34 UTC 2023
ID   CLASS  WEIGHT    TYPE NAME            STATUS  REWEIGHT  PRI-AFF
 -1         16.59212  root default
 -9                0      host f5-422-01
 -7          5.54527      host f5-422-02
  3    ssd   1.86299          osd.3            up   1.00000  1.00000
  9    ssd   1.86299          osd.9            up   1.00000  1.00000
 11    ssd   1.81929          osd.11           up   1.00000  1.00000
 -5          5.50157      host f5-422-03
  4    ssd   1.86299          osd.4            up   1.00000  1.00000
  7    ssd   1.81929          osd.7            up   1.00000  1.00000
  8    ssd   1.81929          osd.8            up   1.00000  1.00000
 -3          5.54527      host f5-422-04
  0    ssd   1.86299          osd.0            up   1.00000  1.00000
  1    ssd   1.86299          osd.1            up   1.00000  1.00000
  5    ssd   1.81929          osd.5            up   1.00000  1.00000
-11                0      host ts-473a-01
[ceph: root@f5-422-01 /]# ceph -s
  cluster:
    id:     720b4911-bb6e-4774-88ae-dc2d3d3b9bfb
    health: HEALTH_OK

  services:
    mon: 3 daemons, quorum f5-422-01,f5-422-02,f5-422-03 (age 119s)
    mgr: f5-422-01(active, since 2h), standbys: f5-422-03, f5-422-02
    mds: 1/1 daemons up, 1 standby
    osd: 9 osds: 9 up (since 67s), 9 in (since 2h)
    rgw: 1 daemon active (1 hosts, 1 zones)

  data:
    volumes: 1/1 healthy
    pools:   16 pools, 329 pgs
    objects: 1.43M objects, 737 GiB
    usage:   2.2 TiB used, 14 TiB / 17 TiB avail
    pgs:     329 active+clean

  io:
    client:   274 KiB/s wr, 0 op/s rd, 15 op/s wr
shut down node 1
[root@f5-422-01 ~]# systemctl poweroff
[root@f5-422-01 ~]# Connection to f5-422-01 closed by remote host.
Connection to f5-422-01 closed.
swapped storage, powered back up
pcfe@t3600 ~ $ ssh -l root f5-422-01
check-mk-agent installed from monitoring server
kickstarted at Mon Jun  8 01:25:42 CEST 2020 for RHEL 8.2 on TerraMaster F5-422
Activate the web console with: systemctl enable --now cockpit.socket

Last login: Fri Mar 17 16:22:15 2023 from 192.168.50.59
lsblk
any tmux running?
error connecting to /tmp/tmux-0/default (No such file or directory)
[root@f5-422-01 ~]# lsblk
NAME                             MAJ:MIN RM   SIZE RO TYPE MOUNTPOINT
sda                                8:0    0 111.8G  0 disk
├─sda1                             8:1    0   512M  0 part /boot/efi
├─sda2                             8:2    0     1G  0 part /boot
└─sda3                             8:3    0 110.3G  0 part
  ├─VG_OS_SSD_bay1-LV_root       253:0    0     4G  0 lvm  /
  ├─VG_OS_SSD_bay1-LV_swap       253:1    0     4G  0 lvm  [SWAP]
  ├─VG_OS_SSD_bay1-LV_home       253:2    0     1G  0 lvm  /home
  ├─VG_OS_SSD_bay1-LV_containers 253:3    0     8G  0 lvm  /var/lib/containers
  ├─VG_OS_SSD_bay1-LV_var_crash  253:4    0    15G  0 lvm  /var/crash
  ├─VG_OS_SSD_bay1-LV_var_log    253:5    0     5G  0 lvm  /var/log
  └─VG_OS_SSD_bay1-LV_var        253:6    0     8G  0 lvm  /var
sdc                                8:32   0   1.9T  0 disk
sdd                                8:48   0   1.8T  0 disk
sde                                8:64   0   1.8T  0 disk
[root@f5-422-01 ~]#
orch picked up the 3 after a short while
[ceph: root@f5-422-01 /]# ceph -W cephadm
  cluster:
    id:     720b4911-bb6e-4774-88ae-dc2d3d3b9bfb
    health: HEALTH_OK

  services:
    mon: 3 daemons, quorum f5-422-01,f5-422-02,f5-422-03 (age 81s)
    mgr: f5-422-03(active, since 18m), standbys: f5-422-02, f5-422-01
    mds: 1/1 daemons up, 1 standby
    osd: 9 osds: 9 up (since 21m), 9 in (since 2h)
    rgw: 1 daemon active (1 hosts, 1 zones)

  data:
    volumes: 1/1 healthy
    pools:   16 pools, 329 pgs
    objects: 1.43M objects, 737 GiB
    usage:   2.2 TiB used, 14 TiB / 17 TiB avail
    pgs:     329 active+clean

  io:
    client:   553 KiB/s wr, 0 op/s rd, 13 op/s wr


2023-03-18T14:15:52.013150+0000 mgr.f5-422-03 [INF] Detected new or changed devices on ceph-ansible.internal.pcfe.net
2023-03-18T14:20:20.567312+0000 mgr.f5-422-03 [INF] Deploying daemon osd.10 on f5-422-01.internal.pcfe.net
2023-03-18T14:20:31.839535+0000 mgr.f5-422-03 [INF] Deploying daemon osd.2 on f5-422-01.internal.pcfe.net
2023-03-18T14:20:44.269021+0000 mgr.f5-422-03 [INF] Deploying daemon osd.6 on f5-422-01.internal.pcfe.net
2023-03-18T14:21:20.815248+0000 mgr.f5-422-03 [INF] Detected new or changed devices on f5-422-01.internal.pcfe.net
2023-03-18T14:22:35.514871+0000 mgr.f5-422-03 [INF] Detected new or changed devices on f5-422-01.internal.pcfe.net
2023-03-18T14:23:50.739530+0000 mgr.f5-422-03 [INF] Detected new or changed devices on f5-422-01.internal.pcfe.net
now waiting for the final reshuffling of PGs to be finished.
[ceph: root@f5-422-01 /]# date ; ceph -s
Sat Mar 18 14:48:26 UTC 2023
  cluster:
    id:     720b4911-bb6e-4774-88ae-dc2d3d3b9bfb
    health: HEALTH_OK

  services:
    mon: 3 daemons, quorum f5-422-01,f5-422-02,f5-422-03 (age 34m)
    mgr: f5-422-03(active, since 52m), standbys: f5-422-02, f5-422-01
    mds: 1/1 daemons up, 1 standby
    osd: 12 osds: 12 up (since 27m), 12 in (since 2h); 75 remapped pgs
    rgw: 1 daemon active (1 hosts, 1 zones)

  data:
    volumes: 1/1 healthy
    pools:   16 pools, 329 pgs
    objects: 1.43M objects, 737 GiB
    usage:   2.3 TiB used, 20 TiB / 22 TiB avail
    pgs:     523749/4304157 objects misplaced (12.168%)
             254 active+clean
             63  active+remapped+backfill_wait
             12  active+remapped+backfilling

  io:
    client:   21 KiB/s rd, 517 KiB/s wr, 21 op/s rd, 29 op/s wr
    recovery: 267 MiB/s, 0 keys/s, 586 objects/s
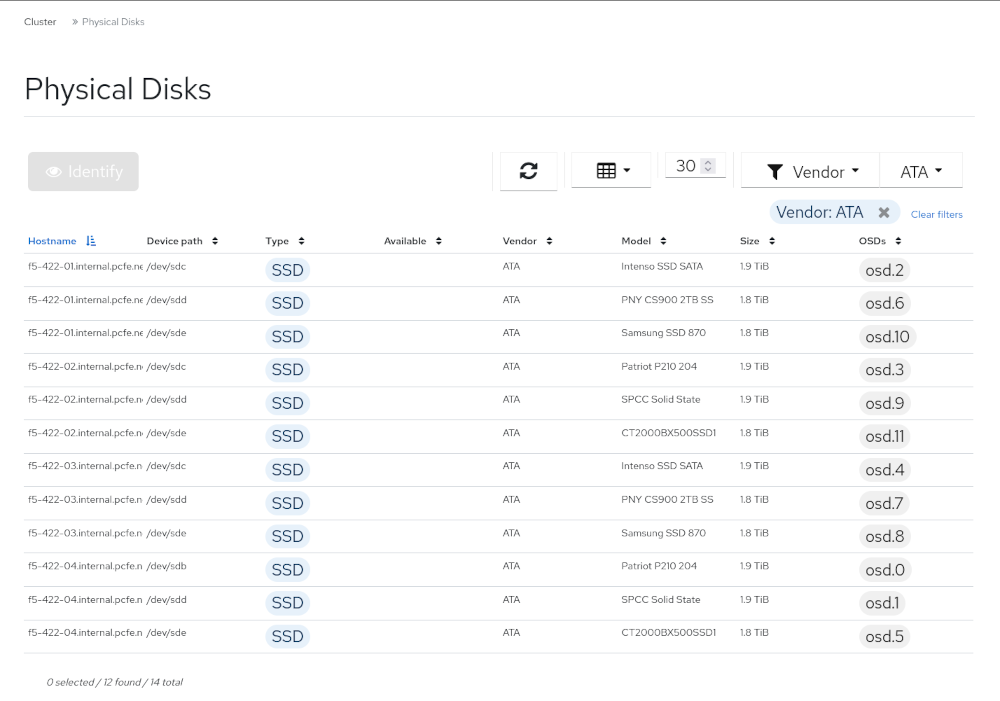
All replacements completed
After replacing them all, I now have the following physical disks used for OSDs.
Once all HDDs were replaced, it was of course time to run some benchmarks. Ideally ones that can at least somehow compare to earlier tests of mine. Note that these days the Ceph cluster also serves my SO’s OCP4 cluster, whereas for the test in 2020 the cluster was brand new and not serving other workloads while I tested. All I want here is some rough numbers.
RADOS Benchmarks
This was straightforward, just the same rados bench runs run on one of the Ceph nodes,
like last time.
All tests were once again run on the node f5-422-01.
Sequential Write Test, pool with 16 PGs
[ceph: root@f5-422-01 /]# rados bench -p testbench 600 write --no-cleanup
[…]
Total time run:         600.186
Total writes made:      20749
Write size:             4194304
Object size:            4194304
Bandwidth (MB/sec):     138.284
Stddev Bandwidth:       32.5208
Max bandwidth (MB/sec): 232
Min bandwidth (MB/sec): 16
Average IOPS:           34
Stddev IOPS:            8.13019
Max IOPS:               58
Min IOPS:               4
Average Latency(s):     0.462764
Stddev Latency(s):      0.375508
Max latency(s):         4.27566
Min latency(s):         0.0361997
Sequential Read Test, pool with 16 PGs
[ceph: root@f5-422-01 /]# rados bench -p testbench 600 seq
[…]
Total time run:       449.178
Total reads made:     20749
Read size:            4194304
Object size:          4194304
Bandwidth (MB/sec):   184.773
Average IOPS:         46
Stddev IOPS:          5.82675
Max IOPS:             64
Min IOPS:             29
Average Latency(s):   0.342997
Max latency(s):       2.15112
Min latency(s):       0.0206885
Random Read Test, pool with 16 PGs
[ceph: root@f5-422-01 /]# rados bench -p testbench 600 rand
Total time run:       600.487
Total reads made:     28454
Read size:            4194304
Object size:          4194304
Bandwidth (MB/sec):   189.54
Average IOPS:         47
Stddev IOPS:          5.39549
Max IOPS:             68
Min IOPS:             34
Average Latency(s):   0.334573
Max latency(s):       2.01502
Min latency(s):       0.00787465
Sequential Write Test, pool with 256 PGs
[ceph: root@f5-422-01 /]# rados bench -p testbench2 600 write --no-cleanup
[…]
Total time run:         600.45
Total writes made:      18984
Write size:             4194304
Object size:            4194304
Bandwidth (MB/sec):     126.465
Stddev Bandwidth:       41.7122
Max bandwidth (MB/sec): 228
Min bandwidth (MB/sec): 0
Average IOPS:           31
Stddev IOPS:            10.4356
Max IOPS:               57
Min IOPS:               0
Average Latency(s):     0.505888
Stddev Latency(s):      0.581471
Max latency(s):         4.40465
Min latency(s):         0.0374363
Sequential Read Test, pool with 256 PGs
[ceph: root@f5-422-01 /]# rados bench -p testbench2 600 seq
[…]
Total time run:       522.082
Total reads made:     18984
Read size:            4194304
Object size:          4194304
Bandwidth (MB/sec):   145.448
Average IOPS:         36
Stddev IOPS:          3.67769
Max IOPS:             52
Min IOPS:             26
Average Latency(s):   0.436814
Max latency(s):       5.47685
Min latency(s):       0.0212489
Random Read Test, pool with 256 PGs
[ceph: root@f5-422-01 /]# rados bench -p testbench2 600 rand
[…]
Total time run:       600.5
Total reads made:     21323
Read size:            4194304
Object size:          4194304
Bandwidth (MB/sec):   142.035
Average IOPS:         35
Stddev IOPS:          3.7057
Max IOPS:             45
Min IOPS:             25
Average Latency(s):   0.447278
Max latency(s):       2.15062
Min latency(s):       0.00771143
VM on ProxmoxVE using RBD benchmarks
This is not fully comparable to earlier tests as this time I used a different hypervisor (one with a better network connection)
The host running the VM has a 10 Gigabit uplink. The 2020 test was with a libvirt hypervisor that only has a 1 Gigabit uplink.
The PVE side the RBD backed disk was of course defined with cache=none as I want to measure my Ceph, not PVE’s caching abilities.
VM side of taking the RBD image in use (click to expand)
[root@guest29 ~]# lsblk
NAME                  MAJ:MIN RM  SIZE RO TYPE MOUNTPOINT
sda                     8:0    0   32G  0 disk
├─sda1                  8:1    0  600M  0 part /boot/efi
├─sda2                  8:2    0    1G  0 part /boot
└─sda3                  8:3    0 30.4G  0 part
  ├─rhel_guest29-root 253:0    0 27.2G  0 lvm  /
  └─rhel_guest29-swap 253:1    0  3.2G  0 lvm  [SWAP]
sr0                    11:0    1 11.3G  0 rom
vda                   252:0    0  100G  0 disk
[root@guest29 ~]# mkfs.xfs /dev/vda
meta-data=/dev/vda               isize=512    agcount=4, agsize=6553600 blks
         =                       sectsz=512   attr=2, projid32bit=1
         =                       crc=1        finobt=1, sparse=1, rmapbt=0
         =                       reflink=1    bigtime=0 inobtcount=0
data     =                       bsize=4096   blocks=26214400, imaxpct=25
         =                       sunit=0      swidth=0 blks
naming   =version 2              bsize=4096   ascii-ci=0, ftype=1
log      =internal log           bsize=4096   blocks=12800, version=2
         =                       sectsz=512   sunit=0 blks, lazy-count=1
realtime =none                   extsz=4096   blocks=0, rtextents=0
Discarding blocks...Done.
[root@guest29 ~]# mount /dev/vdb /mnt/
mount: /mnt: special device /dev/vdb does not exist.
[root@guest29 ~]# mount /dev/vda /mnt/
[root@guest29 ~]# df -h /mnt/
Filesystem      Size  Used Avail Use% Mounted on
/dev/vda        100G  746M  100G   1% /mnt
[root@guest29 ~]# uname -a
Linux guest29.internal.pcfe.net 4.18.0-425.13.1.el8_7.x86_64 #1 SMP Thu Feb 2 13:01:45 EST 2023 x86_64 x86_64 x86_64 GNU/Linux
[root@guest29 ~]# dnf check-upgrade
Updating Subscription Management repositories.
Last metadata expiration check: 0:06:44 ago on Sun 19 Mar 2023 05:07:57 PM CET.
[root@guest29 ~]# mkdir /mnt/fiotest
[root@guest29 ~]# free -h
              total        used        free      shared  buff/cache   available
Mem:          3.8Gi       184Mi       3.2Gi        12Mi       444Mi       3.4Gi
Swap:         3.2Gi          0B       3.2Gi
Sequential Write, 4k Blocksize
WRITE: bw=140MiB/siops: avg=46693.22
fio --name=rbd-test --rw=write --size=16g --directory=/mnt/fiotest/ --bs=4k
[root@guest29 ~]# fio --name=rbd-test --rw=write --size=16g --directory=/mnt/fiotest/ --bs=4k
rbd-test: (g=0): rw=write, bs=(R) 4096B-4096B, (W) 4096B-4096B, (T) 4096B-4096B, ioengine=psync, iodepth=1
fio-3.19
Starting 1 process
rbd-test: Laying out IO file (1 file / 16384MiB)
Jobs: 1 (f=1): [W(1)][100.0%][w=67.9MiB/s][w=17.4k IOPS][eta 00m:00s]
rbd-test: (groupid=0, jobs=1): err= 0: pid=1347: Sat Mar 25 21:13:50 2023
  write: IOPS=35.9k, BW=140MiB/s (147MB/s)(16.0GiB/116787msec); 0 zone resets
    clat (nsec): min=1578, max=27871M, avg=27445.51, stdev=13625842.17
     lat (nsec): min=1629, max=27871M, avg=27506.21, stdev=13625842.18
    clat percentiles (nsec):
     |  1.00th=[    1672],  5.00th=[    1848], 10.00th=[    2256],
     | 20.00th=[    2416], 30.00th=[    2480], 40.00th=[    2512],
     | 50.00th=[    2576], 60.00th=[    2608], 70.00th=[    2704],
     | 80.00th=[    2960], 90.00th=[    3536], 95.00th=[    4192],
     | 99.00th=[   10176], 99.50th=[   13888], 99.90th=[ 8028160],
     | 99.95th=[12386304], 99.99th=[25559040]
   bw (  KiB/s): min=   32, max=790767, per=100.00%, avg=186773.34, stdev=145600.91, samples=178
   iops        : min=    8, max=197691, avg=46693.22, stdev=36400.24, samples=178
  lat (usec)   : 2=7.95%, 4=86.40%, 10=4.64%, 20=0.76%, 50=0.10%
  lat (usec)   : 100=0.01%, 250=0.01%, 500=0.01%, 750=0.03%, 1000=0.01%
  lat (msec)   : 2=0.01%, 4=0.01%, 10=0.05%, 20=0.05%, 50=0.02%
  lat (msec)   : 100=0.01%, 250=0.01%, >=2000=0.01%
  cpu          : usr=3.21%, sys=9.02%, ctx=5485, majf=0, minf=17
  IO depths    : 1=100.0%, 2=0.0%, 4=0.0%, 8=0.0%, 16=0.0%, 32=0.0%, >=64=0.0%
     submit    : 0=0.0%, 4=100.0%, 8=0.0%, 16=0.0%, 32=0.0%, 64=0.0%, >=64=0.0%
     complete  : 0=0.0%, 4=100.0%, 8=0.0%, 16=0.0%, 32=0.0%, 64=0.0%, >=64=0.0%
     issued rwts: total=0,4194304,0,0 short=0,0,0,0 dropped=0,0,0,0
     latency   : target=0, window=0, percentile=100.00%, depth=1

Run status group 0 (all jobs):
  WRITE: bw=140MiB/s (147MB/s), 140MiB/s-140MiB/s (147MB/s-147MB/s), io=16.0GiB (17.2GB), run=116787-116787msec

Disk stats (read/write):
  vda: ios=0/15895, merge=0/5, ticks=0/14068216, in_queue=14068216, util=98.50%
Sequential Write, 4m Blocksize
WRITE: bw=181MiB/siops: avg=46.05
fio --name=rbd-test --rw=write --size=16g --directory=/mnt/fiotest/ --bs=4m
[root@guest29 ~]# fio --name=rbd-test --rw=write --size=16g --directory=/mnt/fiotest/ --bs=4m
rbd-test: (g=0): rw=write, bs=(R) 4096KiB-4096KiB, (W) 4096KiB-4096KiB, (T) 4096KiB-4096KiB, ioengine=psync, iodepth=1
fio-3.19
Starting 1 process
Jobs: 1 (f=1): [W(1)][100.0%][w=184MiB/s][w=45 IOPS][eta 00m:00s]
rbd-test: (groupid=0, jobs=1): err= 0: pid=1412: Sat Mar 25 21:18:02 2023
  write: IOPS=45, BW=181MiB/s (190MB/s)(16.0GiB/90592msec); 0 zone resets
    clat (usec): min=1471, max=2129.4k, avg=21938.67, stdev=46484.99
     lat (usec): min=1526, max=2129.6k, avg=22003.56, stdev=46491.34
    clat percentiles (usec):
     |  1.00th=[   1549],  5.00th=[   1614], 10.00th=[   1663],
     | 20.00th=[   1827], 30.00th=[   2114], 40.00th=[  12125],
     | 50.00th=[  16188], 60.00th=[  18482], 70.00th=[  26608],
     | 80.00th=[  34341], 90.00th=[  47973], 95.00th=[  63177],
     | 99.00th=[ 130548], 99.50th=[ 198181], 99.90th=[ 425722],
     | 99.95th=[ 675283], 99.99th=[2122318]
   bw (  KiB/s): min= 8175, max=630784, per=100.00%, avg=189632.49, stdev=133240.64, samples=175
   iops        : min=    1, max=  154, avg=46.05, stdev=32.59, samples=175
  lat (msec)   : 2=26.37%, 4=11.94%, 10=0.68%, 20=24.37%, 50=27.61%
  lat (msec)   : 100=7.76%, 250=0.98%, 500=0.22%, 750=0.02%, 1000=0.02%
  lat (msec)   : >=2000=0.02%
  cpu          : usr=0.33%, sys=9.03%, ctx=6223, majf=0, minf=14
  IO depths    : 1=100.0%, 2=0.0%, 4=0.0%, 8=0.0%, 16=0.0%, 32=0.0%, >=64=0.0%
     submit    : 0=0.0%, 4=100.0%, 8=0.0%, 16=0.0%, 32=0.0%, 64=0.0%, >=64=0.0%
     complete  : 0=0.0%, 4=100.0%, 8=0.0%, 16=0.0%, 32=0.0%, 64=0.0%, >=64=0.0%
     issued rwts: total=0,4096,0,0 short=0,0,0,0 dropped=0,0,0,0
     latency   : target=0, window=0, percentile=100.00%, depth=1

Run status group 0 (all jobs):
  WRITE: bw=181MiB/s (190MB/s), 181MiB/s-181MiB/s (190MB/s-190MB/s), io=16.0GiB (17.2GB), run=90592-90592msec

Disk stats (read/write):
  vda: ios=0/16111, merge=0/0, ticks=0/11828596, in_queue=11828596, util=97.95%
Sequential Read, 4k Blocksize
READ: bw=196MiB/siops: avg=50392.08
fio --name=rbd-test --rw=read --size=16g --directory=/mnt/fiotest/ --bs=4k
[root@guest29 ~]# fio --name=rbd-test --rw=read --size=16g --directory=/mnt/fiotest/ --bs=4k
rbd-test: (g=0): rw=read, bs=(R) 4096B-4096B, (W) 4096B-4096B, (T) 4096B-4096B, ioengine=psync, iodepth=1
fio-3.19
Starting 1 process
Jobs: 1 (f=1): [R(1)][100.0%][r=222MiB/s][r=56.7k IOPS][eta 00m:00s]
rbd-test: (groupid=0, jobs=1): err= 0: pid=1416: Sat Mar 25 21:20:42 2023
  read: IOPS=50.2k, BW=196MiB/s (206MB/s)(16.0GiB/83520msec)
    clat (nsec): min=807, max=233877k, avg=19463.80, stdev=885938.42
     lat (nsec): min=850, max=233877k, avg=19525.01, stdev=885938.82
    clat percentiles (nsec):
     |  1.00th=[     908],  5.00th=[     948], 10.00th=[     972],
     | 20.00th=[     996], 30.00th=[    1020], 40.00th=[    1032],
     | 50.00th=[    1048], 60.00th=[    1080], 70.00th=[    1096],
     | 80.00th=[    1128], 90.00th=[    1192], 95.00th=[    1272],
     | 99.00th=[    2928], 99.50th=[    7584], 99.90th=[   33024],
     | 99.95th=[11206656], 99.99th=[44302336]
   bw (  KiB/s): min=36978, max=274432, per=100.00%, avg=201568.42, stdev=39879.74, samples=166
   iops        : min= 9244, max=68608, avg=50392.08, stdev=9969.93, samples=166
  lat (nsec)   : 1000=21.06%
  lat (usec)   : 2=77.22%, 4=1.05%, 10=0.24%, 20=0.28%, 50=0.05%
  lat (usec)   : 100=0.01%, 250=0.01%, 500=0.01%, 750=0.01%, 1000=0.01%
  lat (msec)   : 2=0.01%, 4=0.01%, 10=0.02%, 20=0.02%, 50=0.03%
  lat (msec)   : 100=0.01%, 250=0.01%
  cpu          : usr=3.56%, sys=7.02%, ctx=3524, majf=0, minf=14
  IO depths    : 1=100.0%, 2=0.0%, 4=0.0%, 8=0.0%, 16=0.0%, 32=0.0%, >=64=0.0%
     submit    : 0=0.0%, 4=100.0%, 8=0.0%, 16=0.0%, 32=0.0%, 64=0.0%, >=64=0.0%
     complete  : 0=0.0%, 4=100.0%, 8=0.0%, 16=0.0%, 32=0.0%, 64=0.0%, >=64=0.0%
     issued rwts: total=4194304,0,0,0 short=0,0,0,0 dropped=0,0,0,0
     latency   : target=0, window=0, percentile=100.00%, depth=1

Run status group 0 (all jobs):
   READ: bw=196MiB/s (206MB/s), 196MiB/s-196MiB/s (206MB/s-206MB/s), io=16.0GiB (17.2GB), run=83520-83520msec

Disk stats (read/write):
  vda: ios=16358/2, merge=0/0, ticks=973234/37, in_queue=973272, util=94.65%
Sequential Read, 4m Blocksize
READ: bw=199MiB/siops: avg=50.58
fio --name=rbd-test --rw=read --size=16g --directory=/mnt/fiotest/ --bs=4m
[root@guest29 ~]# fio --name=rbd-test --rw=read --size=16g --directory=/mnt/fiotest/ --bs=4m
rbd-test: (g=0): rw=read, bs=(R) 4096KiB-4096KiB, (W) 4096KiB-4096KiB, (T) 4096KiB-4096KiB, ioengine=psync, iodepth=1
fio-3.19
Starting 1 process
Jobs: 1 (f=1): [R(1)][100.0%][r=216MiB/s][r=53 IOPS][eta 00m:00s]
rbd-test: (groupid=0, jobs=1): err= 0: pid=1421: Sat Mar 25 21:23:55 2023
  read: IOPS=49, BW=199MiB/s (209MB/s)(16.0GiB/82165msec)
    clat (usec): min=443, max=845275, avg=19947.46, stdev=32040.72
     lat (usec): min=443, max=845275, avg=19947.72, stdev=32040.68
    clat percentiles (usec):
     |  1.00th=[   502],  5.00th=[   529], 10.00th=[   553], 20.00th=[   603],
     | 30.00th=[   914], 40.00th=[  1745], 50.00th=[  8455], 60.00th=[ 17433],
     | 70.00th=[ 26870], 80.00th=[ 36963], 90.00th=[ 53740], 95.00th=[ 69731],
     | 99.00th=[ 96994], 99.50th=[112722], 99.90th=[287310], 99.95th=[633340],
     | 99.99th=[843056]
   bw (  KiB/s): min=24576, max=270336, per=100.00%, avg=207331.80, stdev=39224.53, samples=161
   iops        : min=    6, max=   66, avg=50.58, stdev= 9.56, samples=161
  lat (usec)   : 500=0.90%, 750=27.81%, 1000=1.98%
  lat (msec)   : 2=10.67%, 4=3.54%, 10=7.30%, 20=10.30%, 50=25.83%
  lat (msec)   : 100=10.91%, 250=0.63%, 500=0.02%, 750=0.07%, 1000=0.02%
  cpu          : usr=0.04%, sys=6.59%, ctx=3550, majf=0, minf=525
  IO depths    : 1=100.0%, 2=0.0%, 4=0.0%, 8=0.0%, 16=0.0%, 32=0.0%, >=64=0.0%
     submit    : 0=0.0%, 4=100.0%, 8=0.0%, 16=0.0%, 32=0.0%, 64=0.0%, >=64=0.0%
     complete  : 0=0.0%, 4=100.0%, 8=0.0%, 16=0.0%, 32=0.0%, 64=0.0%, >=64=0.0%
     issued rwts: total=4096,0,0,0 short=0,0,0,0 dropped=0,0,0,0
     latency   : target=0, window=0, percentile=100.00%, depth=1

Run status group 0 (all jobs):
   READ: bw=199MiB/s (209MB/s), 199MiB/s-199MiB/s (209MB/s-209MB/s), io=16.0GiB (17.2GB), run=82165-82165msec

Disk stats (read/write):
  vda: ios=16374/0, merge=0/0, ticks=982509/0, in_queue=982509, util=97.45%
Sequential, 80% Read, 20% Write, 4k Blocksize
READ: bw=182MiB/siops: avg=46941.35WRITE: bw=45.4MiB/siops: avg=11732.77
fio --name=rbd-test --rw=readwrite --rwmixread=80 --size=16g --directory=/mnt/fiotest/ --bs=4k
[root@guest29 ~]# fio --name=rbd-test --rw=readwrite --rwmixread=80 --size=16g --directory=/mnt/fiotest/ --bs=4k
rbd-test: (g=0): rw=rw, bs=(R) 4096B-4096B, (W) 4096B-4096B, (T) 4096B-4096B, ioengine=psync, iodepth=1
fio-3.19
Starting 1 process
Jobs: 1 (f=1): [M(1)][100.0%][r=178MiB/s,w=44.7MiB/s][r=45.5k,w=11.5k IOPS][eta 00m:00s]
rbd-test: (groupid=0, jobs=1): err= 0: pid=1424: Sat Mar 25 21:25:53 2023
  read: IOPS=46.5k, BW=182MiB/s (190MB/s)(12.8GiB/72175msec)
    clat (nsec): min=805, max=627098k, avg=20144.85, stdev=1047272.38
     lat (nsec): min=843, max=627098k, avg=20187.87, stdev=1047272.48
    clat percentiles (nsec):
     |  1.00th=[     932],  5.00th=[     980], 10.00th=[    1012],
     | 20.00th=[    1064], 30.00th=[    1096], 40.00th=[    1128],
     | 50.00th=[    1176], 60.00th=[    1208], 70.00th=[    1240],
     | 80.00th=[    1288], 90.00th=[    1384], 95.00th=[    1496],
     | 99.00th=[    3376], 99.50th=[   10048], 99.90th=[   36608],
     | 99.95th=[10682368], 99.99th=[45350912]
   bw (  KiB/s): min=36978, max=258048, per=100.00%, avg=187765.51, stdev=40535.60, samples=142
   iops        : min= 9244, max=64512, avg=46941.35, stdev=10133.91, samples=142
  write: IOPS=11.6k, BW=45.4MiB/s (47.6MB/s)(3277MiB/72175msec); 0 zone resets
    clat (nsec): min=1300, max=2313.3k, avg=3144.75, stdev=14867.24
     lat (nsec): min=1344, max=2313.7k, avg=3202.44, stdev=14873.30
    clat percentiles (nsec):
     |  1.00th=[  1816],  5.00th=[  1960], 10.00th=[  2040], 20.00th=[  2256],
     | 30.00th=[  2384], 40.00th=[  2480], 50.00th=[  2544], 60.00th=[  2640],
     | 70.00th=[  2768], 80.00th=[  2928], 90.00th=[  3600], 95.00th=[  4320],
     | 99.00th=[ 12480], 99.50th=[ 15424], 99.90th=[ 38656], 99.95th=[ 58112],
     | 99.99th=[847872]
   bw (  KiB/s): min= 9708, max=63168, per=100.00%, avg=46931.39, stdev=10065.63, samples=142
   iops        : min= 2427, max=15792, avg=11732.77, stdev=2516.38, samples=142
  lat (nsec)   : 1000=6.06%
  lat (usec)   : 2=73.57%, 4=18.37%, 10=1.33%, 20=0.45%, 50=0.13%
  lat (usec)   : 100=0.01%, 250=0.01%, 500=0.01%, 750=0.01%, 1000=0.01%
  lat (msec)   : 2=0.01%, 4=0.01%, 10=0.01%, 20=0.02%, 50=0.02%
  lat (msec)   : 100=0.01%, 250=0.01%, 500=0.01%, 750=0.01%
  cpu          : usr=4.27%, sys=10.50%, ctx=2664, majf=0, minf=21
  IO depths    : 1=100.0%, 2=0.0%, 4=0.0%, 8=0.0%, 16=0.0%, 32=0.0%, >=64=0.0%
     submit    : 0=0.0%, 4=100.0%, 8=0.0%, 16=0.0%, 32=0.0%, 64=0.0%, >=64=0.0%
     complete  : 0=0.0%, 4=100.0%, 8=0.0%, 16=0.0%, 32=0.0%, 64=0.0%, >=64=0.0%
     issued rwts: total=3355445,838859,0,0 short=0,0,0,0 dropped=0,0,0,0
     latency   : target=0, window=0, percentile=100.00%, depth=1

Run status group 0 (all jobs):
   READ: bw=182MiB/s (190MB/s), 182MiB/s-182MiB/s (190MB/s-190MB/s), io=12.8GiB (13.7GB), run=72175-72175msec
  WRITE: bw=45.4MiB/s (47.6MB/s), 45.4MiB/s-45.4MiB/s (47.6MB/s-47.6MB/s), io=3277MiB (3436MB), run=72175-72175msec

Disk stats (read/write):
  vda: ios=13108/3037, merge=0/1, ticks=844664/637742, in_queue=1482406, util=90.78%
Sequential, 80% Read, 20% Write, 4m Blocksize
READ: bw=174MiB/siops: avg=44.48WRITE: bw=45.4MiB/siops: avg=11.60
fio --name=rbd-test --rw=readwrite --rwmixread=80 --size=16g --directory=/mnt/fiotest/ --bs=4m
[root@guest29 ~]# fio --name=rbd-test --rw=readwrite --rwmixread=80 --size=16g --directory=/mnt/fiotest/ --bs=4m
rbd-test: (g=0): rw=rw, bs=(R) 4096KiB-4096KiB, (W) 4096KiB-4096KiB, (T) 4096KiB-4096KiB, ioengine=psync, iodepth=1
fio-3.19
Starting 1 process
Jobs: 1 (f=1): [M(1)][100.0%][r=200MiB/s,w=39.0MiB/s][r=49,w=9 IOPS][eta 00m:00s]
rbd-test: (groupid=0, jobs=1): err= 0: pid=1433: Sat Mar 25 21:29:16 2023
  read: IOPS=43, BW=174MiB/s (182MB/s)(12.7GiB/74761msec)
    clat (usec): min=444, max=1021.3k, avg=22443.71, stdev=44040.41
     lat (usec): min=445, max=1021.3k, avg=22443.95, stdev=44040.37
    clat percentiles (usec):
     |  1.00th=[    502],  5.00th=[    537], 10.00th=[    562],
     | 20.00th=[    611], 30.00th=[    685], 40.00th=[   1614],
     | 50.00th=[   5604], 60.00th=[  15139], 70.00th=[  27919],
     | 80.00th=[  41157], 90.00th=[  61604], 95.00th=[  78119],
     | 99.00th=[ 135267], 99.50th=[ 181404], 99.90th=[ 750781],
     | 99.95th=[ 851444], 99.99th=[1019216]
   bw (  KiB/s): min=16384, max=262144, per=100.00%, avg=182256.38, stdev=47410.09, samples=145
   iops        : min=    4, max=   64, avg=44.48, stdev=11.58, samples=145
  write: IOPS=11, BW=45.4MiB/s (47.6MB/s)(3392MiB/74761msec); 0 zone resets
    clat (usec): min=1076, max=9656, avg=1668.65, stdev=468.88
     lat (usec): min=1130, max=9936, avg=1726.70, stdev=476.32
    clat percentiles (usec):
     |  1.00th=[ 1123],  5.00th=[ 1172], 10.00th=[ 1205], 20.00th=[ 1270],
     | 30.00th=[ 1598], 40.00th=[ 1663], 50.00th=[ 1696], 60.00th=[ 1729],
     | 70.00th=[ 1745], 80.00th=[ 1844], 90.00th=[ 2024], 95.00th=[ 2147],
     | 99.00th=[ 2311], 99.50th=[ 2606], 99.90th=[ 9634], 99.95th=[ 9634],
     | 99.99th=[ 9634]
   bw (  KiB/s): min= 8192, max=139264, per=100.00%, avg=47614.06, stdev=26724.67, samples=144
   iops        : min=    2, max=   34, avg=11.60, stdev= 6.53, samples=144
  lat (usec)   : 500=0.81%, 750=24.34%, 1000=0.66%
  lat (msec)   : 2=27.10%, 4=5.76%, 10=5.52%, 20=7.01%, 50=17.36%
  lat (msec)   : 100=9.57%, 250=1.66%, 500=0.10%, 750=0.02%, 1000=0.07%
  lat (msec)   : 2000=0.02%
  cpu          : usr=0.11%, sys=7.57%, ctx=2730, majf=0, minf=16
  IO depths    : 1=100.0%, 2=0.0%, 4=0.0%, 8=0.0%, 16=0.0%, 32=0.0%, >=64=0.0%
     submit    : 0=0.0%, 4=100.0%, 8=0.0%, 16=0.0%, 32=0.0%, 64=0.0%, >=64=0.0%
     complete  : 0=0.0%, 4=100.0%, 8=0.0%, 16=0.0%, 32=0.0%, 64=0.0%, >=64=0.0%
     issued rwts: total=3248,848,0,0 short=0,0,0,0 dropped=0,0,0,0
     latency   : target=0, window=0, percentile=100.00%, depth=1

Run status group 0 (all jobs):
   READ: bw=174MiB/s (182MB/s), 174MiB/s-174MiB/s (182MB/s-182MB/s), io=12.7GiB (13.6GB), run=74761-74761msec
  WRITE: bw=45.4MiB/s (47.6MB/s), 45.4MiB/s-45.4MiB/s (47.6MB/s-47.6MB/s), io=3392MiB (3557MB), run=74761-74761msec

Disk stats (read/write):
  vda: ios=12971/3192, merge=0/0, ticks=869566/579994, in_queue=1449561, util=95.40%
Random, 80% Read, 20% Write, 4k Blocksize
READ: bw=1324KiB/siops: avg=340.60WRITE: bw=331KiB/siops: avg=85.84
While I expected this to be not good™, results are worse than I would have guessed. But well all my use cases involve some caching, so the numbers here are not too worrysome as me real use should not be as this synthetic test.
fio --name=rbd-test --rw=randrw --rwmixread=80 --size=16g --directory=/mnt/fiotest/ --bs=4k
[root@guest29 ~]# fio --name=rbd-test --rw=randrw --rwmixread=80 --size=16g --directory=/mnt/fiotest/ --bs=4k
rbd-test: (g=0): rw=randrw, bs=(R) 4096B-4096B, (W) 4096B-4096B, (T) 4096B-4096B, ioengine=psync, iodepth=1
fio-3.19
Starting 1 process
Jobs: 1 (f=1): [m(1)][100.0%][r=1730KiB/s,w=443KiB/s][r=432,w=110 IOPS][eta 00m:00s]
rbd-test: (groupid=0, jobs=1): err= 0: pid=2340: Sun Mar 26 14:27:04 2023
  read: IOPS=331, BW=1324KiB/s (1356kB/s)(12.8GiB/10136307msec)
    clat (usec): min=697, max=30885k, avg=3009.66, stdev=28079.13
     lat (usec): min=698, max=30885k, avg=3010.01, stdev=28079.13
    clat percentiles (usec):
     |  1.00th=[  1270],  5.00th=[  1418], 10.00th=[  1500], 20.00th=[  1631],
     | 30.00th=[  1745], 40.00th=[  1909], 50.00th=[  2114], 60.00th=[  2311],
     | 70.00th=[  2540], 80.00th=[  2704], 90.00th=[  2966], 95.00th=[  5276],
     | 99.00th=[ 20841], 99.50th=[ 31851], 99.90th=[ 68682], 99.95th=[183501],
     | 99.99th=[599786]
   bw (  KiB/s): min=    8, max= 2656, per=100.00%, avg=1362.46, stdev=555.01, samples=19700
   iops        : min=    2, max=  664, avg=340.60, stdev=138.76, samples=19700
  write: IOPS=82, BW=331KiB/s (339kB/s)(3277MiB/10136307msec); 0 zone resets
    clat (usec): min=2, max=5118, avg=19.35, stdev=23.17
     lat (usec): min=2, max=5118, avg=19.79, stdev=23.29
    clat percentiles (usec):
     |  1.00th=[    4],  5.00th=[    5], 10.00th=[    5], 20.00th=[   11],
     | 30.00th=[   15], 40.00th=[   17], 50.00th=[   19], 60.00th=[   20],
     | 70.00th=[   21], 80.00th=[   29], 90.00th=[   34], 95.00th=[   37],
     | 99.00th=[   52], 99.50th=[   61], 99.90th=[   79], 99.95th=[  116],
     | 99.99th=[ 1172]
   bw (  KiB/s): min=    7, max=  894, per=100.00%, avg=343.46, stdev=147.67, samples=19536
   iops        : min=    1, max=  223, avg=85.84, stdev=36.92, samples=19536
  lat (usec)   : 4=0.72%, 10=3.12%, 20=9.46%, 50=6.48%, 100=0.21%
  lat (usec)   : 250=0.01%, 500=0.01%, 750=0.01%, 1000=0.01%
  lat (msec)   : 2=35.88%, 4=39.33%, 10=3.05%, 20=0.89%, 50=0.73%
  lat (msec)   : 100=0.07%, 250=0.03%, 500=0.02%, 750=0.01%, 1000=0.01%
  lat (msec)   : 2000=0.01%, >=2000=0.01%
  cpu          : usr=0.37%, sys=1.34%, ctx=3355523, majf=0, minf=18
  IO depths    : 1=100.0%, 2=0.0%, 4=0.0%, 8=0.0%, 16=0.0%, 32=0.0%, >=64=0.0%
     submit    : 0=0.0%, 4=100.0%, 8=0.0%, 16=0.0%, 32=0.0%, 64=0.0%, >=64=0.0%
     complete  : 0=0.0%, 4=100.0%, 8=0.0%, 16=0.0%, 32=0.0%, 64=0.0%, >=64=0.0%
     issued rwts: total=3355445,838859,0,0 short=0,0,0,0 dropped=0,0,0,0
     latency   : target=0, window=0, percentile=100.00%, depth=1

Run status group 0 (all jobs):
   READ: bw=1324KiB/s (1356kB/s), 1324KiB/s-1324KiB/s (1356kB/s-1356kB/s), io=12.8GiB (13.7GB), run=10136307-10136307msec
  WRITE: bw=331KiB/s (339kB/s), 331KiB/s-331KiB/s (339kB/s-339kB/s), io=3277MiB (3436MB), run=10136307-10136307msec

Disk stats (read/write):
  vda: ios=3355366/834422, merge=0/4, ticks=9964327/30041062, in_queue=40005389, util=99.81%
Random, 80% Read, 20% Write, 4m Blocksize
READ: bw=67.2MiB/siops: avg=18.34WRITE: bw=17.5MiB/siops: avg= 5.53
fio --name=rbd-test --rw=randrw --rwmixread=80 --size=16g --directory=/mnt/fiotest/ --bs=4m
[root@guest29 ~]# fio --name=rbd-test --rw=randrw --rwmixread=80 --size=16g --directory=/mnt/fiotest/ --bs=4m
rbd-test: (g=0): rw=randrw, bs=(R) 4096KiB-4096KiB, (W) 4096KiB-4096KiB, (T) 4096KiB-4096KiB, ioengine=psync, iodepth=1
fio-3.19
Starting 1 process
Jobs: 1 (f=1): [m(1)][99.5%][r=87.9MiB/s,w=47.0MiB/s][r=21,w=11 IOPS][eta 00m:01s]
rbd-test: (groupid=0, jobs=1): err= 0: pid=1475: Sat Mar 25 21:52:14 2023
  read: IOPS=16, BW=67.2MiB/s (70.5MB/s)(12.7GiB/193365msec)
    clat (msec): min=41, max=2161, avg=55.61, stdev=69.20
     lat (msec): min=41, max=2161, avg=55.61, stdev=69.20
    clat percentiles (msec):
     |  1.00th=[   44],  5.00th=[   45], 10.00th=[   45], 20.00th=[   45],
     | 30.00th=[   46], 40.00th=[   46], 50.00th=[   46], 60.00th=[   47],
     | 70.00th=[   48], 80.00th=[   50], 90.00th=[   57], 95.00th=[   70],
     | 99.00th=[  262], 99.50th=[  418], 99.90th=[  995], 99.95th=[ 1418],
     | 99.99th=[ 2165]
   bw (  KiB/s): min= 8192, max=90112, per=100.00%, avg=75188.45, stdev=19320.94, samples=353
   iops        : min=    2, max=   22, avg=18.34, stdev= 4.73, samples=353
  write: IOPS=4, BW=17.5MiB/s (18.4MB/s)(3392MiB/193365msec); 0 zone resets
    clat (usec): min=1371, max=5103, avg=1871.27, stdev=428.74
     lat (usec): min=1449, max=5129, avg=1931.56, stdev=434.49
    clat percentiles (usec):
     |  1.00th=[ 1483],  5.00th=[ 1532], 10.00th=[ 1565], 20.00th=[ 1614],
     | 30.00th=[ 1647], 40.00th=[ 1663], 50.00th=[ 1696], 60.00th=[ 1762],
     | 70.00th=[ 1893], 80.00th=[ 2147], 90.00th=[ 2311], 95.00th=[ 2704],
     | 99.00th=[ 3523], 99.50th=[ 3752], 99.90th=[ 5080], 99.95th=[ 5080],
     | 99.99th=[ 5080]
   bw (  KiB/s): min= 8175, max=65536, per=100.00%, avg=22674.75, stdev=13647.46, samples=306
   iops        : min=    1, max=   16, avg= 5.53, stdev= 3.33, samples=306
  lat (msec)   : 2=15.45%, 4=5.15%, 10=0.10%, 50=65.16%, 100=11.62%
  lat (msec)   : 250=1.64%, 500=0.61%, 750=0.10%, 1000=0.10%, 2000=0.05%
  lat (msec)   : >=2000=0.02%
  cpu          : usr=0.04%, sys=2.75%, ctx=6509, majf=0, minf=13
  IO depths    : 1=100.0%, 2=0.0%, 4=0.0%, 8=0.0%, 16=0.0%, 32=0.0%, >=64=0.0%
     submit    : 0=0.0%, 4=100.0%, 8=0.0%, 16=0.0%, 32=0.0%, 64=0.0%, >=64=0.0%
     complete  : 0=0.0%, 4=100.0%, 8=0.0%, 16=0.0%, 32=0.0%, 64=0.0%, >=64=0.0%
     issued rwts: total=3248,848,0,0 short=0,0,0,0 dropped=0,0,0,0
     latency   : target=0, window=0, percentile=100.00%, depth=1

Run status group 0 (all jobs):
   READ: bw=67.2MiB/s (70.5MB/s), 67.2MiB/s-67.2MiB/s (70.5MB/s-70.5MB/s), io=12.7GiB (13.6GB), run=193365-193365msec
  WRITE: bw=17.5MiB/s (18.4MB/s), 17.5MiB/s-17.5MiB/s (18.4MB/s-18.4MB/s), io=3392MiB (3557MB), run=193365-193365msec

Disk stats (read/write):
  vda: ios=13014/4244, merge=0/0, ticks=579911/1582547, in_queue=2162458, util=98.08%
sequential write, 2300 bytes, fsync
WRITE: bw=101KiB/siops: avg=45.15
fio --name=etcd-test --rw=write --ioengine=sync --fdatasync=1 --size=22m --bs=2300 --directory=/mnt/fiotest/
[root@guest29 ~]# fio --name=etcd-test --rw=write --ioengine=sync --fdatasync=1 --size=22m --bs=2300 --directory=/mnt/fiotest/
etcd-test: (g=0): rw=write, bs=(R) 2300B-2300B, (W) 2300B-2300B, (T) 2300B-2300B, ioengine=sync, iodepth=1
fio-3.19
Starting 1 process
etcd-test: Laying out IO file (1 file / 22MiB)
Jobs: 1 (f=1): [W(1)][100.0%][w=186KiB/s][w=82 IOPS][eta 00m:00s]
etcd-test: (groupid=0, jobs=1): err= 0: pid=1436: Sat Mar 25 21:34:32 2023
  write: IOPS=45, BW=101KiB/s (104kB/s)(21.0MiB/222696msec); 0 zone resets
    clat (usec): min=9, max=1535, avg=20.46, stdev=30.24
     lat (usec): min=9, max=1536, avg=20.97, stdev=30.28
    clat percentiles (usec):
     |  1.00th=[   11],  5.00th=[   12], 10.00th=[   12], 20.00th=[   15],
     | 30.00th=[   16], 40.00th=[   17], 50.00th=[   18], 60.00th=[   20],
     | 70.00th=[   22], 80.00th=[   24], 90.00th=[   32], 95.00th=[   37],
     | 99.00th=[   50], 99.50th=[   56], 99.90th=[   78], 99.95th=[  161],
     | 99.99th=[ 1418]
   bw (  KiB/s): min=    4, max=  193, per=99.85%, avg=100.85, stdev=60.58, samples=443
   iops        : min=    2, max=   86, avg=45.15, stdev=26.94, samples=443
  lat (usec)   : 10=0.05%, 20=62.27%, 50=36.73%, 100=0.89%, 250=0.01%
  lat (msec)   : 2=0.05%
  fsync/fdatasync/sync_file_range:
    sync (msec): min=5, max=526, avg=22.18, stdev=35.52
    sync percentiles (msec):
     |  1.00th=[    7],  5.00th=[    8], 10.00th=[    9], 20.00th=[   10],
     | 30.00th=[   12], 40.00th=[   15], 50.00th=[   17], 60.00th=[   18],
     | 70.00th=[   19], 80.00th=[   21], 90.00th=[   27], 95.00th=[   47],
     | 99.00th=[  236], 99.50th=[  288], 99.90th=[  338], 99.95th=[  372],
     | 99.99th=[  430]
  cpu          : usr=0.05%, sys=0.32%, ctx=30229, majf=0, minf=14
  IO depths    : 1=200.0%, 2=0.0%, 4=0.0%, 8=0.0%, 16=0.0%, 32=0.0%, >=64=0.0%
     submit    : 0=0.0%, 4=100.0%, 8=0.0%, 16=0.0%, 32=0.0%, 64=0.0%, >=64=0.0%
     complete  : 0=0.0%, 4=100.0%, 8=0.0%, 16=0.0%, 32=0.0%, 64=0.0%, >=64=0.0%
     issued rwts: total=0,10029,0,0 short=10029,0,0,0 dropped=0,0,0,0
     latency   : target=0, window=0, percentile=100.00%, depth=1

Run status group 0 (all jobs):
  WRITE: bw=101KiB/s (104kB/s), 101KiB/s-101KiB/s (104kB/s-104kB/s), io=21.0MiB (23.1MB), run=222696-222696msec

Disk stats (read/write):
  vda: ios=0/25659, merge=0/4, ticks=0/310626, in_queue=310627, util=100.00%
sequential write, 2300 bytes, NO fsync
WRITE: bw=171MiB/siops: avg=77371.25
fio --name=etcdd-test --rw=write --ioengine=sync --size=16g --bs=2300 --directory=/mnt/fiotest/
[root@guest29 ~]# fio --name=etcdd-test --rw=write --ioengine=sync  --size=16g --bs=2300 --directory=/mnt/fiotest/
etcdd-test: (g=0): rw=write, bs=(R) 2300B-2300B, (W) 2300B-2300B, (T) 2300B-2300B, ioengine=sync, iodepth=1
fio-3.19
Starting 1 process
etcdd-test: Laying out IO file (1 file / 16384MiB)
Jobs: 1 (f=1): [W(1)][99.0%][w=258MiB/s][w=118k IOPS][eta 00m:01s]
etcdd-test: (groupid=0, jobs=1): err= 0: pid=1453: Sat Mar 25 21:39:54 2023
  write: IOPS=77.9k, BW=171MiB/s (179MB/s)(15.0GiB/95839msec); 0 zone resets
    clat (nsec): min=1026, max=207763k, avg=12453.03, stdev=443304.45
     lat (nsec): min=1084, max=207763k, avg=12511.36, stdev=443304.47
    clat percentiles (nsec):
     |  1.00th=[    1080],  5.00th=[    1128], 10.00th=[    1176],
     | 20.00th=[    1224], 30.00th=[    1256], 40.00th=[    1368],
     | 50.00th=[    2384], 60.00th=[    2704], 70.00th=[    2832],
     | 80.00th=[    2928], 90.00th=[    3312], 95.00th=[    3856],
     | 99.00th=[    7456], 99.50th=[   12608], 99.90th=[  108032],
     | 99.95th=[ 8978432], 99.99th=[17694720]
   bw (  KiB/s): min=  256, max=848884, per=99.27%, avg=173782.75, stdev=135308.55, samples=190
   iops        : min=  114, max=377938, avg=77371.25, stdev=60241.76, samples=190
  lat (usec)   : 2=45.65%, 4=50.40%, 10=3.23%, 20=0.55%, 50=0.06%
  lat (usec)   : 100=0.01%, 250=0.01%, 500=0.01%, 750=0.01%, 1000=0.01%
  lat (msec)   : 2=0.01%, 4=0.01%, 10=0.04%, 20=0.04%, 50=0.01%
  lat (msec)   : 100=0.01%, 250=0.01%
  cpu          : usr=6.46%, sys=14.98%, ctx=6237, majf=0, minf=14
  IO depths    : 1=100.0%, 2=0.0%, 4=0.0%, 8=0.0%, 16=0.0%, 32=0.0%, >=64=0.0%
     submit    : 0=0.0%, 4=100.0%, 8=0.0%, 16=0.0%, 32=0.0%, 64=0.0%, >=64=0.0%
     complete  : 0=0.0%, 4=100.0%, 8=0.0%, 16=0.0%, 32=0.0%, 64=0.0%, >=64=0.0%
     issued rwts: total=0,7469508,0,0 short=0,0,0,0 dropped=0,0,0,0
     latency   : target=0, window=0, percentile=100.00%, depth=1

Run status group 0 (all jobs):
  WRITE: bw=171MiB/s (179MB/s), 171MiB/s-171MiB/s (179MB/s-179MB/s), io=15.0GiB (17.2GB), run=95839-95839msec

Disk stats (read/write):
  vda: ios=0/15905, merge=0/4, ticks=0/12849013, in_queue=12849013, util=98.23%
VM on libvirt using RBD benchmarks
These are just for comparison to an earlier test. The host running the VM only has a single 1 Gig Ethernet uplink and I know from the test VM on my Proxmox host that the Ceph cluster now delivers more bandwidth than this libvirt host has (it’s my workstation).
VM side of taking the RBD image in use (click to expand)
[root@guest21 ~]# mkfs.xfs /dev/vdb
meta-data=/dev/vdb               isize=512    agcount=4, agsize=67108864 blks
         =                       sectsz=512   attr=2, projid32bit=1
         =                       crc=1        finobt=1, sparse=1, rmapbt=0
         =                       reflink=1    bigtime=0 inobtcount=0
data     =                       bsize=4096   blocks=268435456, imaxpct=5
         =                       sunit=0      swidth=0 blks
naming   =version 2              bsize=4096   ascii-ci=0, ftype=1
log      =internal log           bsize=4096   blocks=131072, version=2
         =                       sectsz=512   sunit=0 blks, lazy-count=1
realtime =none                   extsz=4096   blocks=0, rtextents=0
Discarding blocks...Done.
[root@guest21 ~]# mount /dev/vdb /mnt/
[root@guest21 ~]# df -h /mnt/
Filesystem      Size  Used Avail Use% Mounted on
/dev/vdb        1.0T  7.2G 1017G   1% /mnt
[root@guest21 ~]# mkdir /mnt/fiotest/
[root@guest21 ~]# uname -r
4.18.0-425.13.1.el8_7.x86_64
[root@guest21 ~]# dnf check-upgrade
Updating Subscription Management repositories.
Last metadata expiration check: 0:06:15 ago on Mon 20 Mar 2023 08:35:28 PM CET.
[root@guest21 ~]# dnf repolist
Updating Subscription Management repositories.
repo id                                    repo name
rhel-8-for-x86_64-appstream-rpms           Red Hat Enterprise Linux 8 for x86_64 - AppStream (RPMs)
rhel-8-for-x86_64-baseos-rpms              Red Hat Enterprise Linux 8 for x86_64 - BaseOS (RPMs)
[root@guest21 ~]#
Sequential Read, 4k Blocksize
READ: bw=107MiB/siops: avg=27482.47
fio --name=readtest --rw=read --size=16g --directory=/mnt/fiotest/ --bs=4k
[root@guest21 ~]# fio --name=readtest --rw=read --size=16g --directory=/mnt/fiotest/ --bs=4k
readtest: (g=0): rw=read, bs=(R) 4096B-4096B, (W) 4096B-4096B, (T) 4096B-4096B, ioengine=psync, iodepth=1
fio-3.19
Starting 1 process
readtest: Laying out IO file (1 file / 16384MiB)
Jobs: 1 (f=1): [R(1)][100.0%][r=106MiB/s][r=27.2k IOPS][eta 00m:00s]
readtest: (groupid=0, jobs=1): err= 0: pid=1338: Mon Mar 20 20:48:21 2023
  read: IOPS=27.5k, BW=107MiB/s (113MB/s)(16.0GiB/152659msec)
    clat (nsec): min=1139, max=229620k, avg=35329.79, stdev=1485689.68
     lat (nsec): min=1191, max=229620k, avg=35476.71, stdev=1485689.87
    clat percentiles (nsec):
     |  1.00th=[    1272],  5.00th=[    1400], 10.00th=[    1464],
     | 20.00th=[    1576], 30.00th=[    2352], 40.00th=[    2992],
     | 50.00th=[    3184], 60.00th=[    3248], 70.00th=[    3344],
     | 80.00th=[    3440], 90.00th=[    3632], 95.00th=[    3792],
     | 99.00th=[   19072], 99.50th=[   40192], 99.90th=[  140288],
     | 99.95th=[22151168], 99.99th=[85458944]
   bw (  KiB/s): min=77446, max=131072, per=100.00%, avg=109931.98, stdev=9122.31, samples=304
   iops        : min=19361, max=32768, avg=27482.47, stdev=2280.57, samples=304
  lat (usec)   : 2=26.98%, 4=69.83%, 10=1.57%, 20=0.63%, 50=0.55%
  lat (usec)   : 100=0.26%, 250=0.09%, 500=0.01%, 750=0.01%, 1000=0.01%
  lat (msec)   : 2=0.01%, 4=0.01%, 10=0.01%, 20=0.01%, 50=0.03%
  lat (msec)   : 100=0.02%, 250=0.01%
  cpu          : usr=5.51%, sys=9.89%, ctx=3285, majf=0, minf=16
  IO depths    : 1=100.0%, 2=0.0%, 4=0.0%, 8=0.0%, 16=0.0%, 32=0.0%, >=64=0.0%
     submit    : 0=0.0%, 4=100.0%, 8=0.0%, 16=0.0%, 32=0.0%, 64=0.0%, >=64=0.0%
     complete  : 0=0.0%, 4=100.0%, 8=0.0%, 16=0.0%, 32=0.0%, 64=0.0%, >=64=0.0%
     issued rwts: total=4194304,0,0,0 short=0,0,0,0 dropped=0,0,0,0
     latency   : target=0, window=0, percentile=100.00%, depth=1

Run status group 0 (all jobs):
   READ: bw=107MiB/s (113MB/s), 107MiB/s-107MiB/s (113MB/s-113MB/s), io=16.0GiB (17.2GB), run=152659-152659msec

Disk stats (read/write):
  vdb: ios=16378/8, merge=0/1, ticks=1880033/636, in_queue=1880668, util=90.76%
Sequential Read, 4m Blocksize
READ: bw=103MiB/siops: avg=24.95
fio --name=readtest --rw=read --size=16g --directory=/mnt/fiotest/ --bs=4m
[root@guest21 ~]# fio --name=readtest --rw=read --size=16g --directory=/mnt/fiotest/ --bs=4m
readtest: (g=0): rw=read, bs=(R) 4096KiB-4096KiB, (W) 4096KiB-4096KiB, (T) 4096KiB-4096KiB, ioengine=psync, iodepth=1
fio-3.19
Starting 1 process
Jobs: 1 (f=1): [R(1)][100.0%][r=108MiB/s][r=26 IOPS][eta 00m:00s]
readtest: (groupid=0, jobs=1): err= 0: pid=1366: Mon Mar 20 21:05:58 2023
  read: IOPS=25, BW=103MiB/s (108MB/s)(16.0GiB/159617msec)
    clat (usec): min=693, max=321996, avg=38794.65, stdev=49394.27
     lat (usec): min=694, max=321998, avg=38796.13, stdev=49394.24
    clat percentiles (usec):
     |  1.00th=[   799],  5.00th=[   955], 10.00th=[  1336], 20.00th=[  1598],
     | 30.00th=[  1729], 40.00th=[  3359], 50.00th=[  7701], 60.00th=[ 27395],
     | 70.00th=[ 55837], 80.00th=[ 85459], 90.00th=[122160], 95.00th=[143655],
     | 99.00th=[162530], 99.50th=[170918], 99.90th=[214959], 99.95th=[254804],
     | 99.99th=[320865]
   bw (  KiB/s): min=65405, max=131072, per=100.00%, avg=105557.24, stdev=12718.77, samples=317
   iops        : min=   15, max=   32, avg=24.95, stdev= 3.15, samples=317
  lat (usec)   : 750=0.24%, 1000=5.79%
  lat (msec)   : 2=27.20%, 4=7.74%, 10=10.40%, 20=5.20%, 50=11.72%
  lat (msec)   : 100=15.92%, 250=15.72%, 500=0.07%
  cpu          : usr=0.07%, sys=7.78%, ctx=3297, majf=0, minf=527
  IO depths    : 1=100.0%, 2=0.0%, 4=0.0%, 8=0.0%, 16=0.0%, 32=0.0%, >=64=0.0%
     submit    : 0=0.0%, 4=100.0%, 8=0.0%, 16=0.0%, 32=0.0%, 64=0.0%, >=64=0.0%
     complete  : 0=0.0%, 4=100.0%, 8=0.0%, 16=0.0%, 32=0.0%, 64=0.0%, >=64=0.0%
     issued rwts: total=4096,0,0,0 short=0,0,0,0 dropped=0,0,0,0
     latency   : target=0, window=0, percentile=100.00%, depth=1

Run status group 0 (all jobs):
   READ: bw=103MiB/s (108MB/s), 103MiB/s-103MiB/s (108MB/s-108MB/s), io=16.0GiB (17.2GB), run=159617-159617msec

Disk stats (read/write):
  vdb: ios=16368/0, merge=0/0, ticks=2047074/0, in_queue=2047074, util=95.09%
Sequential Write, 4k Blocksize
WRITE: bw=81.4MiB/siops: avg=20710.70
fio --name=writetest --rw=write --size=16g --directory=/mnt/fiotest/ --bs=4k
[root@guest21 ~]# fio --name=writetest --rw=write --size=16g --directory=/mnt/fiotest/ --bs=4k
writetest: (g=0): rw=write, bs=(R) 4096B-4096B, (W) 4096B-4096B, (T) 4096B-4096B, ioengine=psync, iodepth=1
fio-3.19
Starting 1 process
writetest: Laying out IO file (1 file / 16384MiB)
Jobs: 1 (f=1): [W(1)][100.0%][w=81.0MiB/s][w=20.0k IOPS][eta 00m:00s]
writetest: (groupid=0, jobs=1): err= 0: pid=1369: Mon Mar 20 21:10:34 2023
  write: IOPS=20.8k, BW=81.4MiB/s (85.3MB/s)(16.0GiB/201381msec); 0 zone resets
    clat (usec): min=3, max=31664, avg=46.07, stdev=547.93
     lat (usec): min=3, max=31664, avg=46.33, stdev=547.94
    clat percentiles (usec):
     |  1.00th=[    4],  5.00th=[    4], 10.00th=[    4], 20.00th=[    4],
     | 30.00th=[    7], 40.00th=[   10], 50.00th=[   10], 60.00th=[   10],
     | 70.00th=[   10], 80.00th=[   10], 90.00th=[   13], 95.00th=[   19],
     | 99.00th=[   71], 99.50th=[  176], 99.90th=[ 8160], 99.95th=[11338],
     | 99.99th=[12256]
   bw (  KiB/s): min=65604, max=812845, per=99.44%, avg=82843.81, stdev=36957.59, samples=401
   iops        : min=16403, max=203211, avg=20710.70, stdev=9239.40, samples=401
  lat (usec)   : 4=21.36%, 10=61.88%, 20=12.28%, 50=2.79%, 100=1.00%
  lat (usec)   : 250=0.22%, 500=0.01%, 750=0.01%, 1000=0.01%
  lat (msec)   : 2=0.01%, 4=0.01%, 10=0.40%, 20=0.07%, 50=0.01%
  cpu          : usr=6.78%, sys=16.79%, ctx=19491, majf=0, minf=13
  IO depths    : 1=100.0%, 2=0.0%, 4=0.0%, 8=0.0%, 16=0.0%, 32=0.0%, >=64=0.0%
     submit    : 0=0.0%, 4=100.0%, 8=0.0%, 16=0.0%, 32=0.0%, 64=0.0%, >=64=0.0%
     complete  : 0=0.0%, 4=100.0%, 8=0.0%, 16=0.0%, 32=0.0%, 64=0.0%, >=64=0.0%
     issued rwts: total=0,4194304,0,0 short=0,0,0,0 dropped=0,0,0,0
     latency   : target=0, window=0, percentile=100.00%, depth=1

Run status group 0 (all jobs):
  WRITE: bw=81.4MiB/s (85.3MB/s), 81.4MiB/s-81.4MiB/s (85.3MB/s-85.3MB/s), io=16.0GiB (17.2GB), run=201381-201381msec

Disk stats (read/write):
  vdb: ios=0/15844, merge=0/4, ticks=0/27150060, in_queue=27150060, util=99.56%
Sequential Write, 4m Blocksize
WRITE: bw=85.9MiB/siops: avg=20.69
fio --name=writetest --rw=write --size=16g --directory=/mnt/fiotest/ --bs=4m
[root@guest21 ~]# fio --name=writetest --rw=write --size=16g --directory=/mnt/fiotest/ --bs=4m
writetest: (g=0): rw=write, bs=(R) 4096KiB-4096KiB, (W) 4096KiB-4096KiB, (T) 4096KiB-4096KiB, ioengine=psync, iodepth=1
fio-3.19
Starting 1 process
Jobs: 1 (f=1): [W(1)][100.0%][w=79.8MiB/s][w=19 IOPS][eta 00m:00s]
writetest: (groupid=0, jobs=1): err= 0: pid=1374: Mon Mar 20 21:14:36 2023
  write: IOPS=21, BW=85.9MiB/s (90.1MB/s)(16.0GiB/190748msec); 0 zone resets
    clat (usec): min=1592, max=183102, avg=46168.11, stdev=12784.28
     lat (usec): min=1648, max=183382, avg=46393.96, stdev=12794.64
    clat percentiles (usec):
     |  1.00th=[  1811],  5.00th=[ 32113], 10.00th=[ 35390], 20.00th=[ 40109],
     | 30.00th=[ 41681], 40.00th=[ 44827], 50.00th=[ 45351], 60.00th=[ 47449],
     | 70.00th=[ 49546], 80.00th=[ 53216], 90.00th=[ 59507], 95.00th=[ 67634],
     | 99.00th=[ 81265], 99.50th=[ 87557], 99.90th=[108528], 99.95th=[127402],
     | 99.99th=[183501]
   bw (  KiB/s): min=32702, max=1054658, per=100.00%, avg=88297.97, stdev=51626.48, samples=379
   iops        : min=    7, max=  257, avg=20.69, stdev=12.63, samples=379
  lat (msec)   : 2=2.29%, 4=0.63%, 10=0.05%, 20=0.05%, 50=67.85%
  lat (msec)   : 100=28.96%, 250=0.17%
  cpu          : usr=0.75%, sys=8.00%, ctx=20234, majf=0, minf=13
  IO depths    : 1=100.0%, 2=0.0%, 4=0.0%, 8=0.0%, 16=0.0%, 32=0.0%, >=64=0.0%
     submit    : 0=0.0%, 4=100.0%, 8=0.0%, 16=0.0%, 32=0.0%, 64=0.0%, >=64=0.0%
     complete  : 0=0.0%, 4=100.0%, 8=0.0%, 16=0.0%, 32=0.0%, 64=0.0%, >=64=0.0%
     issued rwts: total=0,4096,0,0 short=0,0,0,0 dropped=0,0,0,0
     latency   : target=0, window=0, percentile=100.00%, depth=1

Run status group 0 (all jobs):
  WRITE: bw=85.9MiB/s (90.1MB/s), 85.9MiB/s-85.9MiB/s (90.1MB/s-90.1MB/s), io=16.0GiB (17.2GB), run=190748-190748msec

Disk stats (read/write):
  vdb: ios=0/15892, merge=0/0, ticks=0/25821278, in_queue=25821278, util=99.15%
Sequential, 80% Read, 20% Write, 4k Blocksize
READ: bw=97.7MiB/siops: avg=25029.70WRITE: bw=24.4MiB/siops: avg=6256.78
fio --name=read80write20test --rw=readwrite --rwmixread=80 --size=16g --directory=/mnt/fiotest/ --bs=4k
[root@guest21 ~]# fio --name=read80write20test --rw=readwrite --rwmixread=80 --size=16g --directory=/mnt/fiotest/ --bs=4k
read80write20test: (g=0): rw=rw, bs=(R) 4096B-4096B, (W) 4096B-4096B, (T) 4096B-4096B, ioengine=psync, iodepth=1
fio-3.19
Starting 1 process
read80write20test: Laying out IO file (1 file / 16384MiB)
Jobs: 1 (f=1): [M(1)][99.3%][r=106MiB/s,w=26.2MiB/s][r=27.1k,w=6696 IOPS][eta 00m:01s]
read80write20test: (groupid=0, jobs=1): err= 0: pid=1387: Mon Mar 20 21:21:09 2023
  read: IOPS=25.0k, BW=97.7MiB/s (102MB/s)(12.8GiB/134185msec)
    clat (nsec): min=1114, max=386692k, avg=36088.52, stdev=1603607.30
     lat (nsec): min=1167, max=386692k, avg=36244.56, stdev=1603607.33
    clat percentiles (nsec):
     |  1.00th=[    1352],  5.00th=[    1464], 10.00th=[    1512],
     | 20.00th=[    1640], 30.00th=[    2040], 40.00th=[    2704],
     | 50.00th=[    3120], 60.00th=[    3312], 70.00th=[    3440],
     | 80.00th=[    3600], 90.00th=[    4048], 95.00th=[    4448],
     | 99.00th=[   20352], 99.50th=[   41216], 99.90th=[  146432],
     | 99.95th=[20316160], 99.99th=[85458944]
   bw (  KiB/s): min=32702, max=130810, per=100.00%, avg=100120.35, stdev=18395.24, samples=267
   iops        : min= 8175, max=32702, avg=25029.70, stdev=4598.73, samples=267
  write: IOPS=6251, BW=24.4MiB/s (25.6MB/s)(3277MiB/134185msec); 0 zone resets
    clat (usec): min=2, max=2826, avg= 9.17, stdev=13.73
     lat (usec): min=2, max=2826, avg= 9.37, stdev=13.85
    clat percentiles (usec):
     |  1.00th=[    3],  5.00th=[    3], 10.00th=[    4], 20.00th=[    5],
     | 30.00th=[    6], 40.00th=[    7], 50.00th=[    8], 60.00th=[   10],
     | 70.00th=[   10], 80.00th=[   10], 90.00th=[   14], 95.00th=[   19],
     | 99.00th=[   53], 99.50th=[   86], 99.90th=[  133], 99.95th=[  157],
     | 99.99th=[  314]
   bw (  KiB/s): min= 8119, max=33029, per=100.00%, avg=25028.41, stdev=4603.53, samples=267
   iops        : min= 2029, max= 8257, avg=6256.78, stdev=1150.88, samples=267
  lat (usec)   : 2=23.52%, 4=51.48%, 10=19.44%, 20=3.92%, 50=1.10%
  lat (usec)   : 100=0.35%, 250=0.12%, 500=0.01%, 750=0.01%, 1000=0.01%
  lat (msec)   : 2=0.01%, 4=0.01%, 10=0.01%, 20=0.01%, 50=0.02%
  lat (msec)   : 100=0.02%, 250=0.01%, 500=0.01%
  cpu          : usr=7.20%, sys=13.53%, ctx=2694, majf=0, minf=21
  IO depths    : 1=100.0%, 2=0.0%, 4=0.0%, 8=0.0%, 16=0.0%, 32=0.0%, >=64=0.0%
     submit    : 0=0.0%, 4=100.0%, 8=0.0%, 16=0.0%, 32=0.0%, 64=0.0%, >=64=0.0%
     complete  : 0=0.0%, 4=100.0%, 8=0.0%, 16=0.0%, 32=0.0%, 64=0.0%, >=64=0.0%
     issued rwts: total=3355445,838859,0,0 short=0,0,0,0 dropped=0,0,0,0
     latency   : target=0, window=0, percentile=100.00%, depth=1

Run status group 0 (all jobs):
   READ: bw=97.7MiB/s (102MB/s), 97.7MiB/s-97.7MiB/s (102MB/s-102MB/s), io=12.8GiB (13.7GB), run=134185-134185msec
  WRITE: bw=24.4MiB/s (25.6MB/s), 24.4MiB/s-24.4MiB/s (25.6MB/s-25.6MB/s), io=3277MiB (3436MB), run=134185-134185msec

Disk stats (read/write):
  vdb: ios=13120/3142, merge=0/3, ticks=1615070/38929, in_queue=1653999, util=88.28%
Sequential, 80% Read, 20% Write, 4m Blocksize
READ: bw=97.0MiB/siops: avg=23.57WRITE: bw=25.3MiB/siops: avg= 6.04
fio --name=read80write20test --rw=readwrite --rwmixread=80 --size=16g --directory=/mnt/fiotest/ --bs=4m
[root@guest21 ~]# fio --name=read80write20test --rw=readwrite --rwmixread=80 --size=16g --directory=/mnt/fiotest/ --bs=4m
read80write20test: (g=0): rw=rw, bs=(R) 4096KiB-4096KiB, (W) 4096KiB-4096KiB, (T) 4096KiB-4096KiB, ioengine=psync, iodepth=1
fio-3.19
Starting 1 process
Jobs: 1 (f=1): [M(1)][100.0%][r=79.8MiB/s,w=63.9MiB/s][r=19,w=15 IOPS][eta 00m:00s]
read80write20test: (groupid=0, jobs=1): err= 0: pid=1391: Mon Mar 20 21:24:07 2023
  read: IOPS=24, BW=97.0MiB/s (102MB/s)(12.7GiB/133923msec)
    clat (usec): min=714, max=471420, avg=40075.34, stdev=52774.81
     lat (usec): min=715, max=471421, avg=40076.83, stdev=52774.70
    clat percentiles (usec):
     |  1.00th=[   816],  5.00th=[   963], 10.00th=[  1237], 20.00th=[  1614],
     | 30.00th=[  1762], 40.00th=[  3064], 50.00th=[ 10028], 60.00th=[ 30016],
     | 70.00th=[ 54264], 80.00th=[ 85459], 90.00th=[120062], 95.00th=[143655],
     | 99.00th=[202376], 99.50th=[248513], 99.90th=[316670], 99.95th=[379585],
     | 99.99th=[471860]
   bw (  KiB/s): min=32702, max=131072, per=100.00%, avg=99904.80, stdev=19149.75, samples=265
   iops        : min=    7, max=   32, avg=23.57, stdev= 4.74, samples=265
  write: IOPS=6, BW=25.3MiB/s (26.6MB/s)(3392MiB/133923msec); 0 zone resets
    clat (usec): min=986, max=9089, avg=3457.38, stdev=1500.40
     lat (usec): min=1036, max=9471, avg=3622.83, stdev=1535.59
    clat percentiles (usec):
     |  1.00th=[ 1106],  5.00th=[ 1549], 10.00th=[ 1893], 20.00th=[ 2114],
     | 30.00th=[ 2278], 40.00th=[ 2540], 50.00th=[ 3163], 60.00th=[ 4047],
     | 70.00th=[ 4359], 80.00th=[ 4555], 90.00th=[ 5276], 95.00th=[ 6325],
     | 99.00th=[ 7767], 99.50th=[ 8356], 99.90th=[ 9110], 99.95th=[ 9110],
     | 99.99th=[ 9110]
   bw (  KiB/s): min= 8110, max=98304, per=100.00%, avg=28232.20, stdev=16757.83, samples=245
   iops        : min=    1, max=   24, avg= 6.04, stdev= 4.09, samples=245
  lat (usec)   : 750=0.12%, 1000=4.71%
  lat (msec)   : 2=24.93%, 4=15.26%, 10=15.33%, 20=4.42%, 50=10.11%
  lat (msec)   : 100=12.67%, 250=12.08%, 500=0.37%
  cpu          : usr=0.20%, sys=9.49%, ctx=2680, majf=0, minf=16
  IO depths    : 1=100.0%, 2=0.0%, 4=0.0%, 8=0.0%, 16=0.0%, 32=0.0%, >=64=0.0%
     submit    : 0=0.0%, 4=100.0%, 8=0.0%, 16=0.0%, 32=0.0%, 64=0.0%, >=64=0.0%
     complete  : 0=0.0%, 4=100.0%, 8=0.0%, 16=0.0%, 32=0.0%, 64=0.0%, >=64=0.0%
     issued rwts: total=3248,848,0,0 short=0,0,0,0 dropped=0,0,0,0
     latency   : target=0, window=0, percentile=100.00%, depth=1

Run status group 0 (all jobs):
   READ: bw=97.0MiB/s (102MB/s), 97.0MiB/s-97.0MiB/s (102MB/s-102MB/s), io=12.7GiB (13.6GB), run=133923-133923msec
  WRITE: bw=25.3MiB/s (26.6MB/s), 25.3MiB/s-25.3MiB/s (26.6MB/s-26.6MB/s), io=3392MiB (3557MB), run=133923-133923msec

Disk stats (read/write):
  vdb: ios=12993/3237, merge=0/0, ticks=1740150/33009, in_queue=1773159, util=93.71%
sequential write, 2300 bytes, fsync
WRITE: bw=71.9KiB/siops: avg=32.50
fio --rw=write --ioengine=sync --fdatasync=1 --size=22m --bs=2300 --name=etcdtest --directory=/mnt/fiotest/
[root@guest21 ~]# fio --rw=write --ioengine=sync --fdatasync=1 --size=22m --bs=2300 --name=etcdtest --directory=/mnt/fiotest/
etcdtest: (g=0): rw=write, bs=(R) 2300B-2300B, (W) 2300B-2300B, (T) 2300B-2300B, ioengine=sync, iodepth=1
fio-3.19
Starting 1 process
etcdtest: Laying out IO file (1 file / 22MiB)
Jobs: 1 (f=1): [W(1)][99.7%][w=114KiB/s][w=50 IOPS][eta 00m:01s]
etcdtest: (groupid=0, jobs=1): err= 0: pid=1568: Mon Mar 20 21:44:36 2023
  write: IOPS=32, BW=71.9KiB/s (73.6kB/s)(21.0MiB/313385msec); 0 zone resets
    clat (usec): min=14, max=444, avg=54.91, stdev=22.56
     lat (usec): min=14, max=445, avg=56.20, stdev=22.80
    clat percentiles (usec):
     |  1.00th=[   19],  5.00th=[   29], 10.00th=[   36], 20.00th=[   38],
     | 30.00th=[   42], 40.00th=[   49], 50.00th=[   51], 60.00th=[   55],
     | 70.00th=[   60], 80.00th=[   69], 90.00th=[   85], 95.00th=[   96],
     | 99.00th=[  127], 99.50th=[  137], 99.90th=[  182], 99.95th=[  273],
     | 99.99th=[  330]
   bw (  KiB/s): min=    4, max=  210, per=100.00%, avg=74.15, stdev=35.57, samples=602
   iops        : min=    1, max=   93, avg=32.50, stdev=15.86, samples=602
  lat (usec)   : 20=1.38%, 50=45.19%, 100=49.29%, 250=4.09%, 500=0.06%
  fsync/fdatasync/sync_file_range:
    sync (msec): min=5, max=1610, avg=31.18, stdev=53.58
    sync percentiles (msec):
     |  1.00th=[    9],  5.00th=[   11], 10.00th=[   13], 20.00th=[   16],
     | 30.00th=[   19], 40.00th=[   22], 50.00th=[   24], 60.00th=[   28],
     | 70.00th=[   30], 80.00th=[   36], 90.00th=[   47], 95.00th=[   68],
     | 99.00th=[  138], 99.50th=[  203], 99.90th=[ 1003], 99.95th=[ 1250],
     | 99.99th=[ 1603]
  cpu          : usr=0.09%, sys=0.48%, ctx=30288, majf=0, minf=12
  IO depths    : 1=200.0%, 2=0.0%, 4=0.0%, 8=0.0%, 16=0.0%, 32=0.0%, >=64=0.0%
     submit    : 0=0.0%, 4=100.0%, 8=0.0%, 16=0.0%, 32=0.0%, 64=0.0%, >=64=0.0%
     complete  : 0=0.0%, 4=100.0%, 8=0.0%, 16=0.0%, 32=0.0%, 64=0.0%, >=64=0.0%
     issued rwts: total=0,10029,0,0 short=10029,0,0,0 dropped=0,0,0,0
     latency   : target=0, window=0, percentile=100.00%, depth=1

Run status group 0 (all jobs):
  WRITE: bw=71.9KiB/s (73.6kB/s), 71.9KiB/s-71.9KiB/s (73.6kB/s-73.6kB/s), io=21.0MiB (23.1MB), run=313385-313385msec

Disk stats (read/write):
  vdb: ios=0/25682, merge=0/4, ticks=0/313614, in_queue=313614, util=100.00%
sequential write, 2300 bytes, NO fsync
WRITE: bw=101MiB/siops: avg=45746.66
fio --rw=write --ioengine=sync --size=16g --bs=2300 --name=etcdtest --directory=/mnt/fiotest/
[root@guest21 ~]# fio --rw=write --ioengine=sync  --size=16g --bs=2300 --name=etcdtest --directory=/mnt/fiotest/
etcdtest: (g=0): rw=write, bs=(R) 2300B-2300B, (W) 2300B-2300B, (T) 2300B-2300B, ioengine=sync, iodepth=1
fio-3.19
Starting 1 process
etcdtest: Laying out IO file (1 file / 16384MiB)
Jobs: 1 (f=1): [W(1)][100.0%][w=97.8MiB/s][w=44.6k IOPS][eta 00m:00s]
etcdtest: (groupid=0, jobs=1): err= 0: pid=1622: Mon Mar 20 23:53:50 2023
  write: IOPS=45.9k, BW=101MiB/s (106MB/s)(15.0GiB/162817msec); 0 zone resets
    clat (nsec): min=1967, max=73232k, avg=20253.25, stdev=340705.21
     lat (usec): min=2, max=73232, avg=20.45, stdev=340.71
    clat percentiles (usec):
     |  1.00th=[    3],  5.00th=[    3], 10.00th=[    3], 20.00th=[    4],
     | 30.00th=[    5], 40.00th=[    6], 50.00th=[    6], 60.00th=[    7],
     | 70.00th=[   10], 80.00th=[   10], 90.00th=[   11], 95.00th=[   14],
     | 99.00th=[   44], 99.50th=[   62], 99.90th=[ 7439], 99.95th=[ 9372],
     | 99.99th=[11338]
   bw (  KiB/s): min=83544, max=519038, per=99.72%, avg=102751.82, stdev=32582.46, samples=324
   iops        : min=37195, max=231085, avg=45746.66, stdev=14506.30, samples=324
  lat (usec)   : 2=0.01%, 4=24.24%, 10=63.12%, 20=9.88%, 50=2.01%
  lat (usec)   : 100=0.49%, 250=0.09%, 500=0.01%, 750=0.01%, 1000=0.01%
  lat (msec)   : 2=0.01%, 4=0.01%, 10=0.11%, 20=0.04%, 50=0.01%
  lat (msec)   : 100=0.01%
  cpu          : usr=12.73%, sys=27.16%, ctx=11507, majf=0, minf=16
  IO depths    : 1=100.0%, 2=0.0%, 4=0.0%, 8=0.0%, 16=0.0%, 32=0.0%, >=64=0.0%
     submit    : 0=0.0%, 4=100.0%, 8=0.0%, 16=0.0%, 32=0.0%, 64=0.0%, >=64=0.0%
     complete  : 0=0.0%, 4=100.0%, 8=0.0%, 16=0.0%, 32=0.0%, 64=0.0%, >=64=0.0%
     issued rwts: total=0,7469508,0,0 short=0,0,0,0 dropped=0,0,0,0
     latency   : target=0, window=0, percentile=100.00%, depth=1

Run status group 0 (all jobs):
  WRITE: bw=101MiB/s (106MB/s), 101MiB/s-101MiB/s (106MB/s-106MB/s), io=15.0GiB (17.2GB), run=162817-162817msec

Disk stats (read/write):
  vdb: ios=0/15891, merge=0/4, ticks=0/21726052, in_queue=21726052, util=99.40%
Conclusion
For now this mainly gives me more peace of mind, some of the HDDs used perviously had died and all had power on hours between 5 and 8 years.
Even with all 4 nodes set to
- no swap
- tuned profile throughput-performance
- reduced osd_memory_target
I still get latency spikes in the seconds range (yes, full seconds, not low ms range). A Picture from the Ceph Dashboard follows:
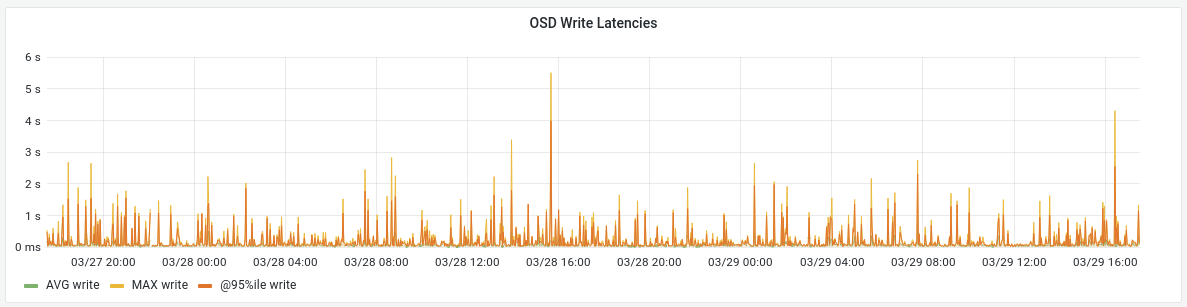
Which is no wonder as I do have noticeable network error rates on the 10 GbE Aquantia interfaces these days. A screenshot of my checkmk server follows, it shows 25 hours of error rates on node 1 (the other 3 are pretty much the same):
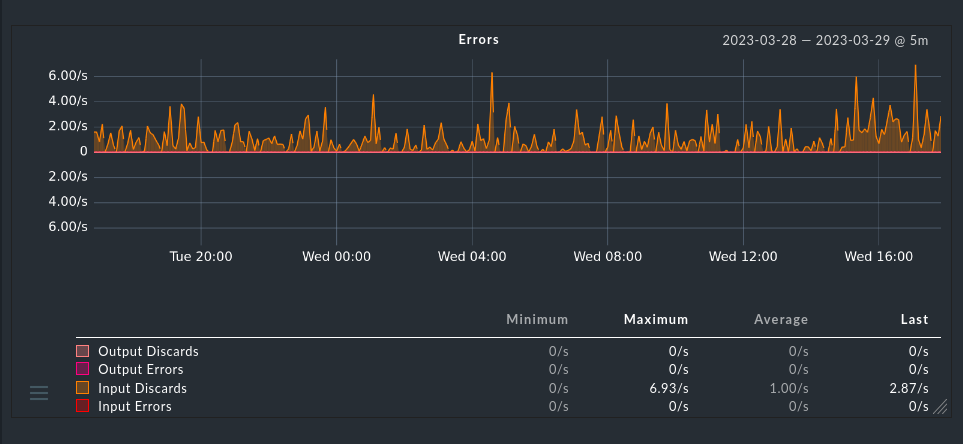
And the state of the built-in 1 GbE interfaces is not rosy either these days.
When the F5-422 are eventually replaced, the SATA SSDs will of course be recycled in the new nodes.
All in all, the Ceph side was painless (and was done while the cluster was actively used) but in 2020 I really should have spent a bit more money for higher quality nodes.
As the German saying goes; When you buy cheap, you buy twice.